Cadillac or Chevrolet?
In this lesson, students receive cards with pictures of 15 cars, ranging from very old to the most recent. Their task is to sort the cars by age. After revealing the correct order, we will discuss together how to numerically evaluate the accuracy of their sorting so that we can determine which group performed the task best. Then, we will look at how well a computer handles the task and describe the method it uses.
Instead of cars, we could use other images that can be arranged on a timeline (inventions, book etc.) or any other objects that can be ordered according to some property (towns by distance from the school’s location). This way, the activity can reinforce material in various subjects.
In a trial with a (fifth-grade) class, the cars interested girls just as much as boys.
The activity requires addition and subtraction of numbers up to 20, and at the end, the addition of small two-digit numbers. The appropriate grade for this lesson thus depends on the level of math difficulty we want to include.
From the perspective of computer science and artificial intelligence, we will observe machine learning (classification) and model quality evaluation.
The lesson can also be conducted without a computer. In that case, the connection to artificial intelligence will only come through the question of how to assess the correctness of the sorting.
Preparation
We will divide the students into smaller groups—preferably pairs. Tip: if we’re working with cars, it’s better that the pairs are not mixed; otherwise, the boys may push the girls aside, claiming they don’t know anything about cars. For each pair or group, we’ll need to print three sheets of paper (and cut two into cards).
From the page https://data.pumice.si/timeline, we download the cards with images. The page contains pictures of cars. If we want to use our own images, we upload an xlsx file with image URLs listed in the first column. Don’t include too many items, as sorting becomes too difficult; fifteen is a good number.
The page assigns a random number to each image, from which the correct order can be calculated. Since we want to hide the rule from the students and reveal it during the lesson, the page is designed to create a new rule each time. Make sure to write it down!
For an example set of car cards published on this page (prepare your own version!), the correct position of a car is determined by adding the second and fourth digits and subtracting the first. So the car with the number 2817 is at position 8 + 7 - 2 = 13.
Print and cut the cards. Shuffle each set of cards, as they are printed in the correct order.
Also print the table available at sheet for recording and calculating results. Each group gets its own table.
Verification
Tell the students the rule by which they can calculate the correct position of each image based on the numbers shown—for example, “add the second and fourth digits and subtract the first” (the rule will be different each time a new PDF is prepared).
Students should calculate the correct position of each car and write it in the third column of the table.
How would we determine which group performed the task best? If they suggest something based on comparing the order, ask how they would (numerically) evaluate the “error in order.” All options are quite complex. One is, for example, the number of adjacent swaps needed to convert their order into the correct one (Kendall tau distance). That calculation is too complicated.
Most likely, they’ll suggest counting how many cars are in the correct position. At this point, you can write the following counterexample on the board: for instance, imagine two groups have the following tables (without the middle column):
Group 1 Group 2 1 2 1 8 2 1 2 5 3 4 3 2 4 3 4 4 5 6 5 6 6 5 6 3 7 8 7 1 8 7 8 7 . . . . . . . . . . . . Which group did better? The one on the left has no cars in the correct position, while the right has one—so according to that criterion, the right is better. But in reality, the left group is clearly much closer, just a bit unlucky, while the right … has no clue.
Sooner or later, someone will suggest calculating how far each car is from the position it should be in. The total sorting error would then be the sum of these distances.
In the third column, they should write the distance between the position they assigned to each car (first column) and the correct position. They compute the absolute differences. Write an example on the board and emphasize that they should always subtract the smaller number from the larger: whether the 12th car is in the 8th position or the 8th in the 12th, the distance is 4.
At the end, they add up all the distances and get the total sorting error. They write it at the bottom of the last column.
Now find out which group had the lowest error.
Connection to Artificial Intelligence
If we want to stop here, without using a computer, we can still link the lesson to model evaluation.
Artificial intelligence is based on models. A model is a procedure used to make a prediction or provide an answer. Large language models (LLMs) are models that generate responses based on input questions. As students probably know, these models vary in quality.
The quality of large language models is hard to measure. But simpler models can be evaluated. A model that predicts whether it will rain or be sunny tomorrow can be judged by how often it makes mistakes (this is called predictive accuracy). A model that identifies all images of cats in a collection can be evaluated by how many of the cat images it finds (recall) and how many of the returned images actually contain cats (precision).
Model evaluation is necessary so that when multiple models are available, we can choose the best one. Or to see whether a change to a model improves or worsens it.
Each student group was a kind of model, and we compared their performance using an error metric we devised. Now we know who in the class is the biggest expert on old and new cars.
As a side note, we can also mention steganography, or “hidden writing.” Steganography is similar to encryption but hides the message within other data. For example, we might send someone a message that hides a secret by using the first letter of each line. What we did with the numbers on the car cards is also an example of steganography: the correct order of the cars was hidden within the numbers on the images.
Experiment with the Computer
Note: This part currently works only with the car images. Using custom images would require more advanced knowledge of the Orange program.
Ask the students whether a computer could also sort the cars by age.
If they answer that “ChatGPT” could do it or that the computer would “look up the images online and check the years”: yes, but what we’re interested in is whether it could work without that. Could it learn from the images we show it to recognize which cars are older and which are newer?
Load the prepared workflow and open it in the Orange program. Double-click on “Compare Pairs” to open the widget.
Explain how the program is built: it contains a “prediction model” that learns from examples. For each pair of cars, it will predict which one is older, and then we tell it (more precisely: the program tells itself after each prediction) whether it was correct or not.
At first, the model knows nothing, so it simply guesses, but it learns from feedback about the correctness of its predictions.
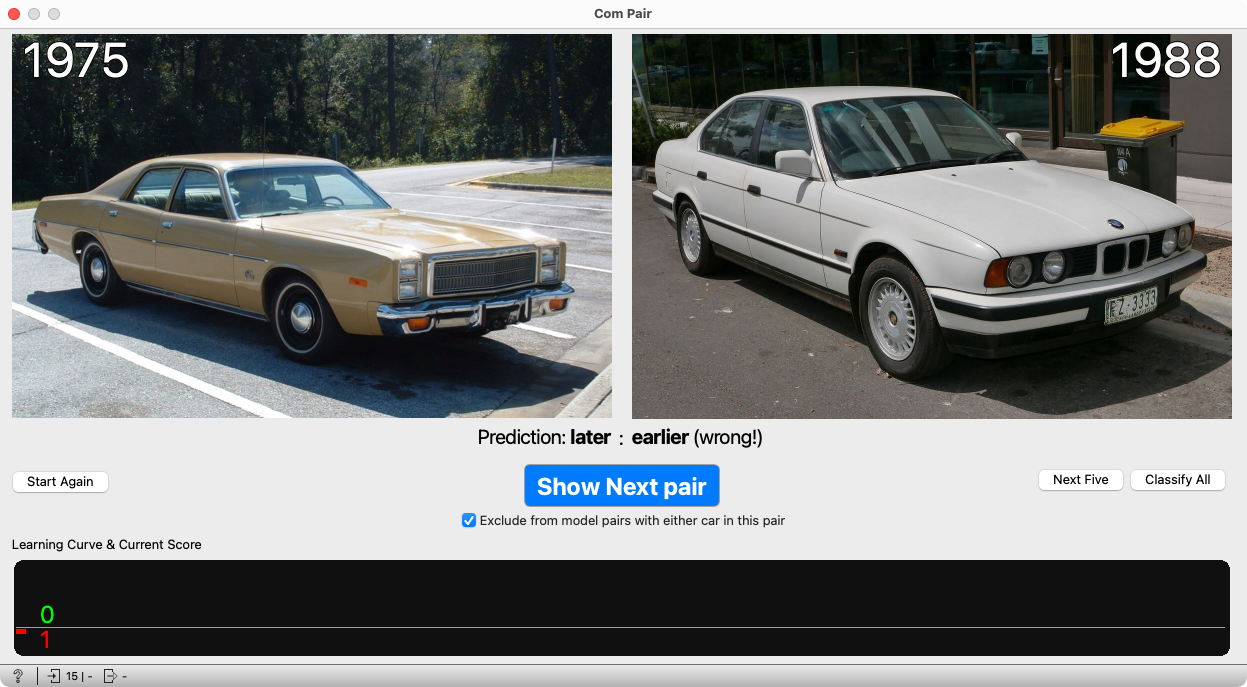
Two car images are displayed. Press “Predict”: since the model knows nothing, it randomly selects one car as the older and the other as the newer.
Years appear above the images, and below them is the model’s prediction. In this case, it was wrong. (This happened by chance; it could have guessed correctly. But it’s better if we get lucky and it confuses a clearly old car with a new one—showing that it really knows nothing yet.)
Emphasize that after the prediction, the model is told which of the two cars is actually older.
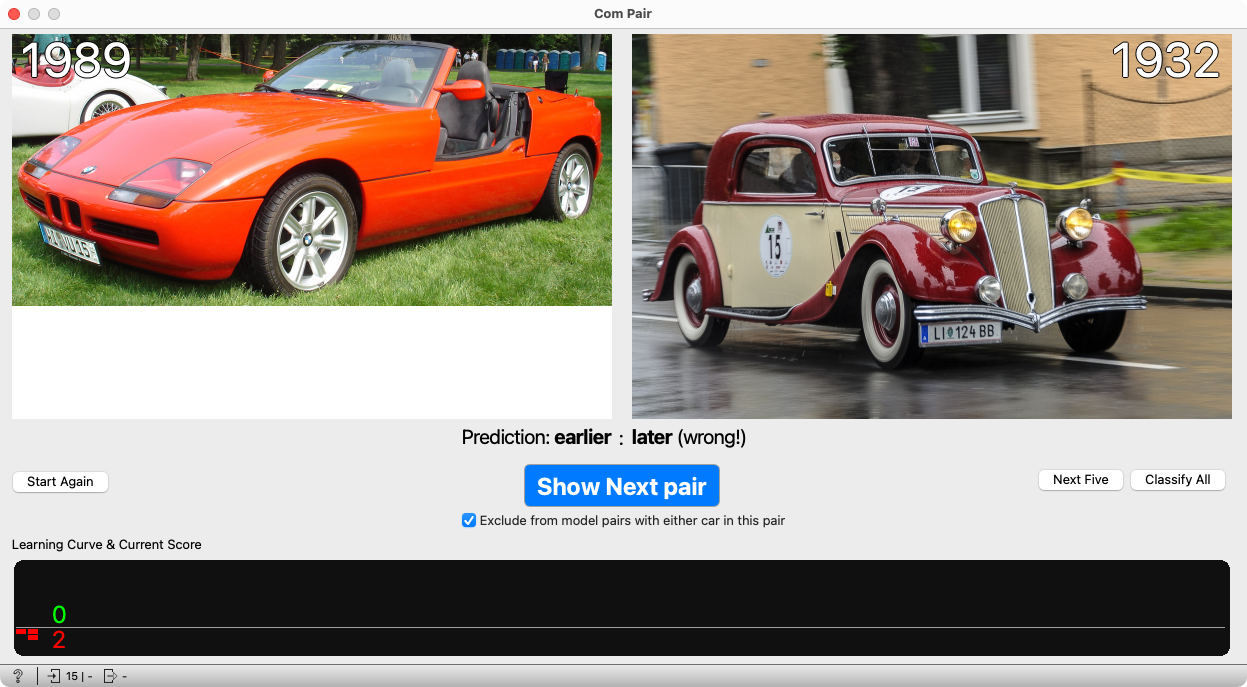
Continue with the next pair. When we press “Predict,” the model guesses again. In this case, it missed again.
The model has now seen two image pairs and learned which car was older in each. From now on, it won’t just guess—it will base its decisions on similarities to cars it has already seen. After each prediction, it still receives feedback on whether it was correct.
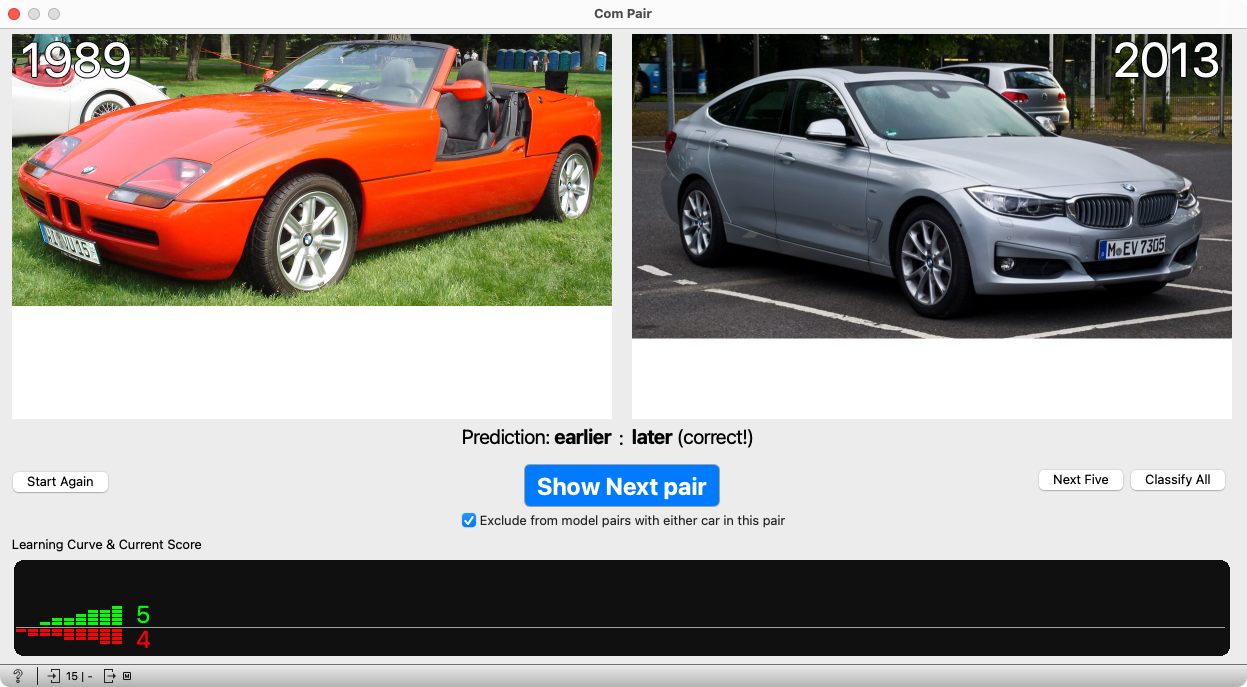
We continue pressing the button. At the bottom of the widget, the number of correct and incorrect predictions is displayed, along with a graph (each column represents a new step, and the height of the green and red bars shows the number of correct and incorrect predictions up to that point). This allows students to see how the computer learns. At first, it makes more mistakes, but later those become rare.
And rarer and rarer…
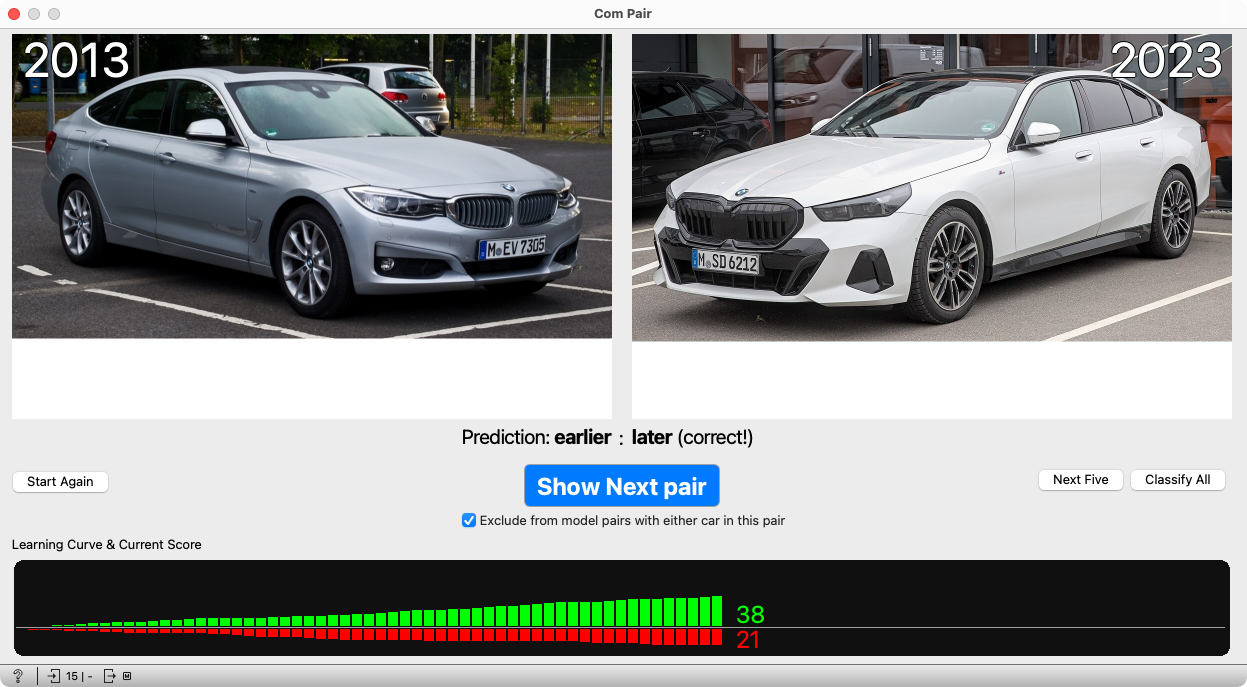
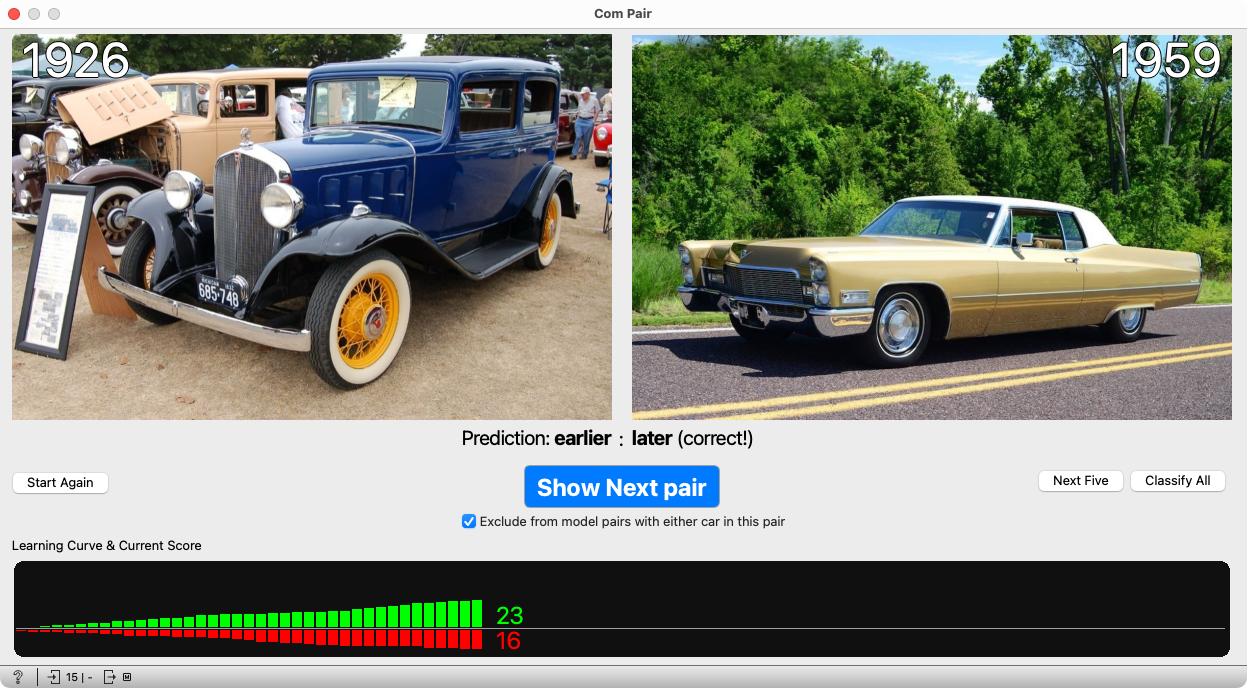
When pressing the button becomes tedious, you can use the option to let the computer make the next five predictions, or even have it predict until all pairs are used up. This way, we’ll see that after a while, it practically stops making mistakes.
Technical note. This detail is intended primarily for teachers—it’s good to know. We wanted to find out whether a computer can learn to compare cars by age based on their appearance. However, it can cheat: if it learns that car A is older than B and B is older than C, it can infer that A is older than C. Since cars begin to repeat quickly and this kind of reasoning is much simpler, the model’s success would mostly come from memorizing and combining such relationships. We confirmed this when designing the lesson by running a simple test: we assigned randomly shuffled years to the cars, and the model’s accuracy remained the same!
To prevent this, the program is written so that, for each prediction, the model temporarily “forgets” all previous pairs involving either of the two cars being compared.
If we want to discuss this with the students, we can demonstrate it by configuring the widget to allow learning from pairs that include one of the cars in the current comparison. We’ll see that the model’s accuracy increases much faster without this safeguard, and that the total number of errors is two or three times lower. That’s still learning, of course—but it’s learning through memorizing previously seen cars and their relationships, not through learning from the images themselves.
Optional: Explanation of Operation
This will be carried out and explained by teachers who feel confident enough. Use the following scenario if it seems meaningful to demonstrate this with a computer. (It is quite impressive.) If you don’t have the time or knowledge for this, you can explain it on the board instead.
Students will be interested in how such a model works. We start with a simpler problem: if the computer had the card numbers available and for some examples we told it the correct position in the order, could it guess the rule by which we add and subtract digits to get the correct position?
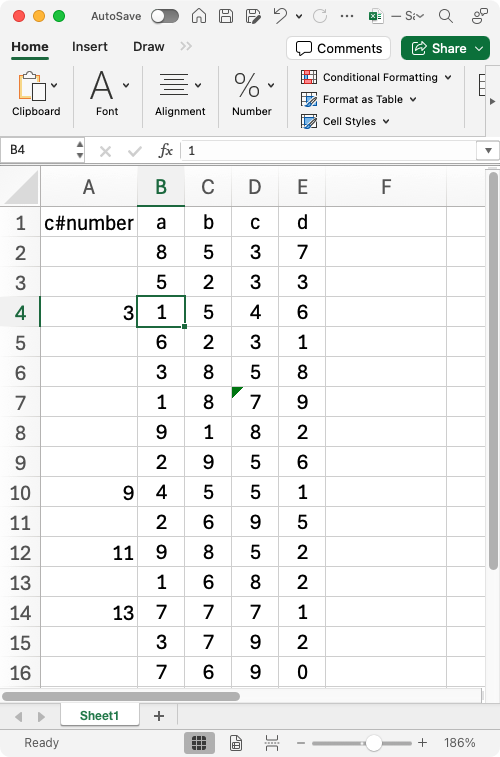
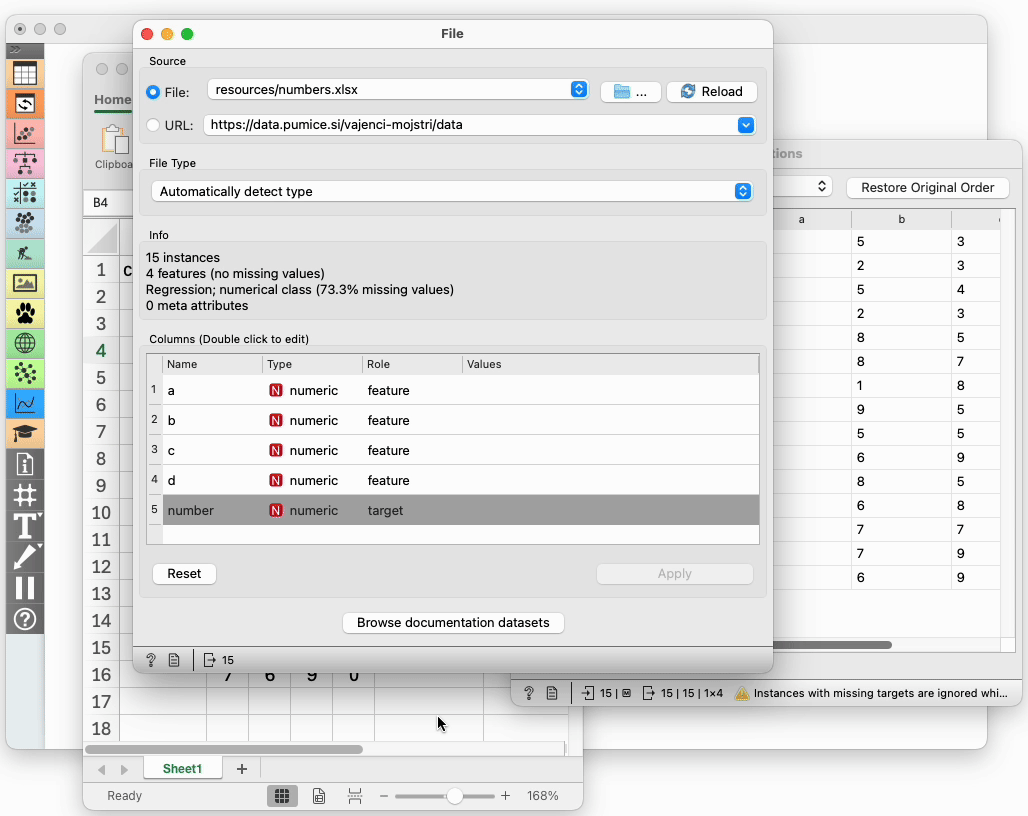
We download the table with numbers and open it in Excel for a start. Columns 2–5 contain digits similar to those on the car images. The rule for these numbers is to add the second and third digits (columns labeled “b” and “c”) and subtract the fourth (column “d”). The first column contains four-digit numbers calculated from the digits on the right. Could the computer discover the rule?
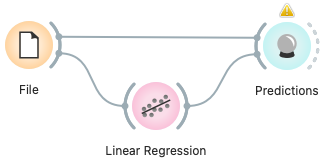
Open the prepared workflow in Orange. The File widget reads the above table from the web and feeds it to the Linear Regression widget: its task is to discover the rule for adding and subtracting digits from the four columns to obtain the number in the first column. The widget then passes the constructed model to the Predictions widget, which also receives the entire data table.

Open the Predictions widget. In the far-left column (“Linear Regression”), the model’s predictions are displayed: we see they are correct—numbers from 1 to 15.
Tell the students that the order does not matter and that it does not help the model. We can prove this in the next step.
Students will be skeptical, so we do the following. The File widget currently reads data from the web. Instead, open the same file as shown in Excel with it. Modify the table as the students wish: you can shuffle rows, add new rows (with an empty first column to see if the model can predict those as well…), or delete any number in the first column (to see that the model no longer works) and replace it by correctly entering the number in some other row.
After each change, you must save the file in Excel and press “Reload” in the File widget in Orange. Then observe the result in the Predictions widget.
The model will work correctly if at least four rows in the first column are correctly filled.
Tell the students that there are not so many different combinations of addition and subtraction, so computer could try them all in sequence and find one that gives the correct result for the examples in the first column.
(You can keep quiet about the fact that this is “ordinary” linear regression, which belongs more to statistics than artificial intelligence. The computer doesn’t “try combinations,” it just calculates coefficients. This detail is not important for the lesson’s flow.)
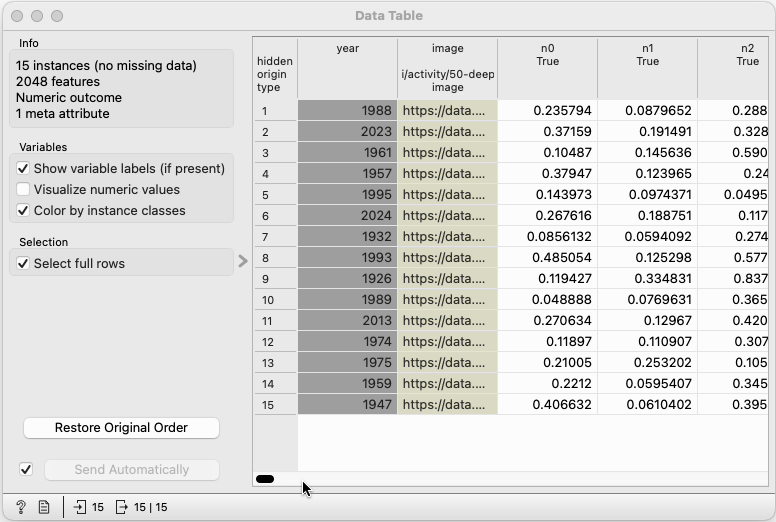
Now open the Table widget in the lower part of the workflow. It contains data about the cars the model worked with. Each image is described by 2048 numbers that encode its appearance in a way a computer “understands.” When the model gets a pair of images, it receives twice 2048 numbers — that is, 4096 numbers. Like the previous model, it computes sums, but it can multiply individual numbers by some coefficient before adding them. For example, it might take five times the first number, subtract seven times the second, and three times the third.
The model must predict which car is older; the result it computes is a sum, a number. It uses it this way: if the sum is less than zero, the first car is older; otherwise, the second is. The “learning” here is finding a rule for summing these 4096 numbers so that the sum is negative when the first car is older, and positive when the second is. Finding a suitable rule for summing 4096 numbers is naturally much harder than for four numbers, so four examples aren’t enough — the model needed about 20–30 pairs to find a rule that works (fairly well). The principle is the same.
Technical notes. Actually, the model doesn’t get 4096 numbers but 2048, which are obtained by subtracting the numbers for the first car from those of the second. Without this trick, the model would need more examples for equally successful learning. This can safely be left out in class as it doesn’t affect understanding.
The numbers describing the images are not the colors of the pixels in the image. It’s appropriate to tell students this, but in our classroom tests we did not explain what these numbers really are or how they are obtained. The students did not complain.
- Subject: mathematics, history, ...?
- Duration: 1 hour
- Age: 4th grade and up
- AI topic: classification
- Author of idea: Ana Farič and Janez Demšar
- Materials
- Preparation for the lesson
- 🖨️ Print this page
- print and cut the cards, print the sheets (for each group)
- if we want to show how the computer approaches the problem, we need a computer with the Orange program and the Pumice add-on installed
- Further explanation