Hierarchical Clustering
It often makes sense to observe data by grouping them together, for example, groups of similar countries, images or people. We use hierarchical clustering in several lessons. To explain it, we can do the kinesthetic activity described here.
Preparation of “data”
Draw the axes of the scatter diagram on the floor of the classroom or a suitably sized room (you will need about 3x3 metres) using painter’s tape. If we don’t have tape, we will just wave around a bit more.
We will place the students in a scatter diagram according to their math knowledge and football skills. We can give them random names, but we arrange them in such a way that we get three groups and a lone student. (Let’s make it fun: we declare a typical football player a mathematician, or vice versa. Of course, let’s make sure we don’t offend anyone.)
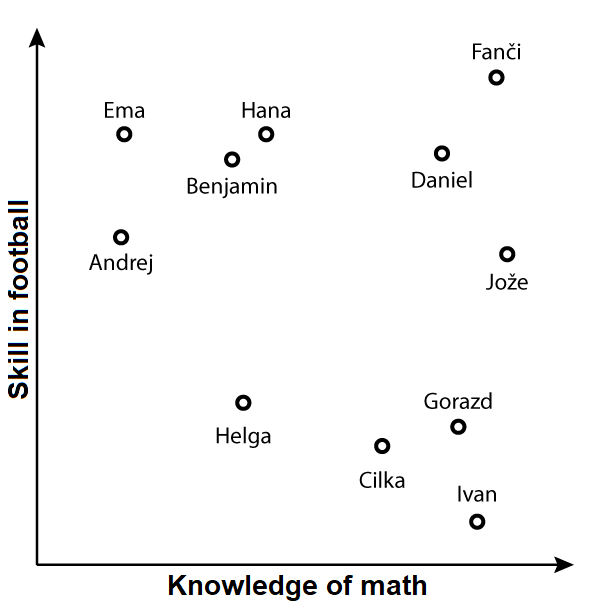
In the example above, we have two excellent footballers, Ema and Hana, with Ema not being particularly good at math but Hana not being much better either. Fanči, for example, excels at both. Ivan, on the other hand, is a pronounced mathematician who has two left feet for football.
We ask students this: if we were to divide students into groups according to their football and math skills, how many groups do we have? Here, probably three: footballers, mathematicians and those who are both. And we have Helga, who is not good at any of these.
But how would we use a computer to determine the groups?
Clustering process
At the beginning, we say that each student is a group of itself.
In the first step, we will put together the two students who are most similar. Using a tape measure, we measure the distances (at least between those who are a little closer, for example Gorazd and Cilka, Gorazd and Ivan, and Hana and Benjamin). Hana and Benjamin are the closest, so they will be in the same group. To remember this, Hana puts her hand on Benjamin’s shoulder.
In the next step, we again search for the nearest pair. We measure and find that it is probably Gorazd and Cilka. Gorazd puts his hand on Cilka’s shoulder.
The next closest couple are Gorazd and Ivan. So Gorazd will put his hand on Ivan’s shoulder (or vice versa). That makes three students in this group.
We continue to do so. Sometimes we merge individuals, sometimes we add individuals to groups, towards the end we merge whole groups. It can get a bit tricky with the hands; it may happen that the person who is supposed to join the groups has both hands already occupied. In this case we need to reorganise a little; instead of Gorazd having his hand on Ivan’s shoulder, Ivan will have his hand on Gorazd’s shoulder, and Gorazd will have one hand free. But there can be no running out of hands.
Keep doing this as long as you can - either until the end, or until your arms get too short. Both are appropriate for explaining the algorithm. If we go to the end, we explain that we have obtained a hierarchy of groups. If we finish a little earlier, we say that the grouping stops when the groups get too big.
How does a computer do this?
The same, except that some details cannot just be swept under the carpet.
Here we use what we call “air distance” to measure distances. In practice, there are different definitions of distances, and we also need to be careful with the norm. If the data would have different scales of measurement (body height in metres is between 1 and 2, weight in kilograms is between 30 and 100), they need to be multiplied accordingly to make them comparable to each other. Categorical variables, such as eye colour, should also be treated appropriately.
The second detail is the distance between the groups. How far apart are the two groups? As far as its nearest members or its furthest members? Or do we calculate the average distance? This is called the linkage function. In this demonstration we measure the closest distance, but in practice a more complicated definition works best, which is a bit - but not quite - like the average distance.
This demonstration will typically be part of the processing of some concrete data and will continue by demonstrating the process in the Hierarchical Clustering widget.
- Subject:
- Age:
- AI topic:
- Preparation for the lesson
- painter's tape for marking the axis of the graph on the floor
- tape measure