Notes from the First Pilot Lesson: Real World Gives Real Insights!
In mid-May, we tried out our very first Pumice lesson in the sixth grade of the Alojzij Šuštar Primary School in Ljubljana, and – based on an excellent suggestion by Anže Rozman from the Prežihov Voranc Primary School (We promise to be there soon, too!), we chose the topic of quadrilaterals in mathematics.
The idea behind this activity was to demonstrate how a computer can use examples of quadrilaterals to derive from them rules for their identification. From the perspective of mathematics, on the other hand, the children learned – hopefully in a fun way, how to recognize rectangles.
The primary purpose of this blog post is not so much describing the activity itself, but above all, collecting and describing our observations on the practical aspects of its implementation. Doing so, we hope to illustrate how much we can learn from this kind of testing of classroom activities, and how such experiments are useful in helping us refine these activities.
Activity - at a Glance
The students were already familiar with squares and rectangles, which they described as quadrilaterals »whose sides are all equal« or »whose opposite sides are equal.« Based on their description, we drew a »tilted version of both a square and a rectangle«, pointing to the students that according to their definition, these too can be called a square and a rectangle. Consequently, they had to adjust their rule to also include that a square or a rectangle »only contains right angles.« One student suddenly remembered that a tilted rectangle is in fact called a parallelo… paralleoid? paralleloid?… something like that anyway. Slowly, in this manner, we then also arrived to the geometric shapes of a parallelogram, rhombus, kite, and a trapezoid. For each of them, we wrote down how they can be identified.
We then divided the children into groups of three. Each group got five worksheets. On each of the worksheets, there was a geometric shape and a combination of pictures of a frog, a fish, and a hedgehog (containing one, two, all, or none of the animals). The children were also given tablets, to write down into a Google spreadsheet the characteristics of the geometric shape that was depicted (all sides equal, two pairs of equal sides, two pairs of parallel sides, one pair of parallel sides, all right angles), as well as which of the animals were pictured on the worksheet. And next to that, of course, also the name of the shape.
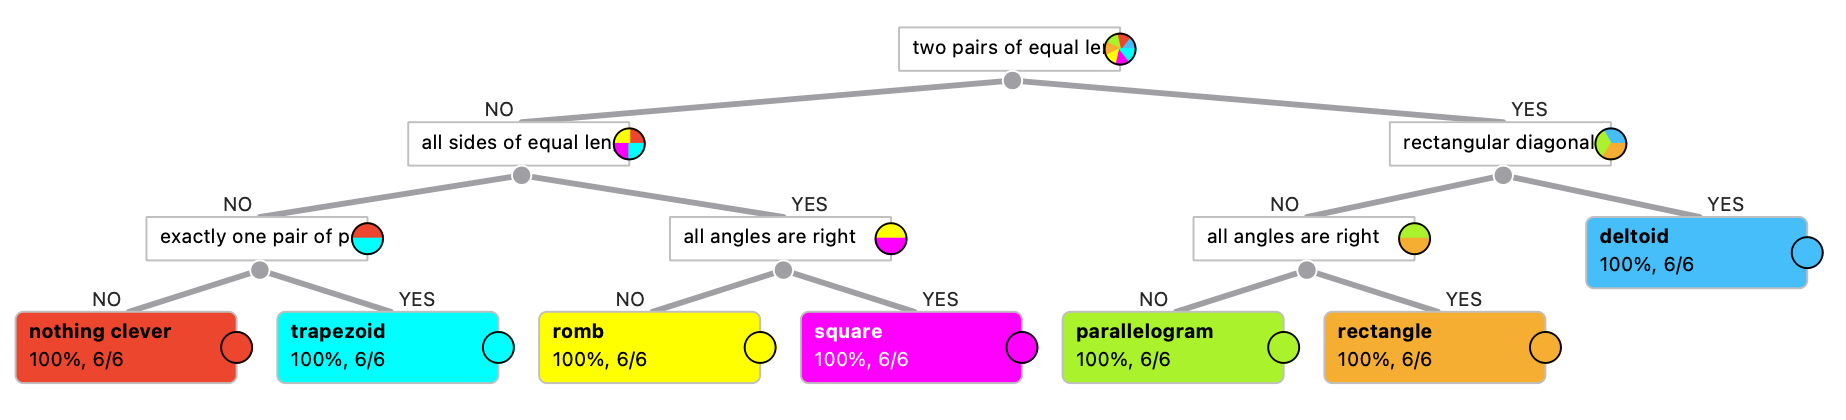
At the end of the lesson, we used this data to build a classification tree. We expected something like this:
Classification tree, as imagined by the workshop facilitators
We then also explained to the students that in the same way, a computer can, for example, construct rules to diagnose a disease.
Takeaways
From the perspective of mathematics, this activity is interesting. The fact that students get »worksheets« which they then fill out in groups, is nothing extraordinary. What is interesting however, is that the results they come up with get merged together and are then used to produce something.
Trapezoids are the Hardest. It turns out that children have the most problems with trapezoids. Parallelograms (tilted rectangles) and deltoids (kites) are easy, and a rhombus is simply a parallelogram with equal sides. But the trapezoids puzzled them. Sometimes, looking at one, it’s simply not that easy to see that this weirdo has a pair of parallel sides. To not complicate things unnecessarily, we have now adjusted the materials to describe trapezoids as lower in height and »horizontal«, which will hopefully make them easier to recognize.
Too Little Time! The first part – learning about geometric shapes, took us 25 minutes! We could have shortened it slightly, but then again, not that much. Anže, who proposed this activity, had already warned us that this topic belongs to 7th grade matematics. Still, we thought it wouldn’t be that hard to explain it briefly at the start of the lesson. Because of this, only 5 minutes were left towards the the end of the lesson for the part on AI. Next time, we will definitely shorten the first part of the activity as much as possible… or simply move the activity as a whole into the 7th grade, where the students already know the different types of quadrilaterals, so the activity can serve as a refresher.
Mistakes in Labelling Can Be Useful. So, what was the use of including hedgehogs, fish, and frogs? None whatsoever when it comes to the classification of quadrilaterals (and the worksheets were purposefully designed in a way that has each animal appear in exactly one half of the exaples of each geometric shape, making sure they really are totally useless). The idea was to show the kids that the computer can recognize the animals as useless and therefore ignore them. But it didn’t!
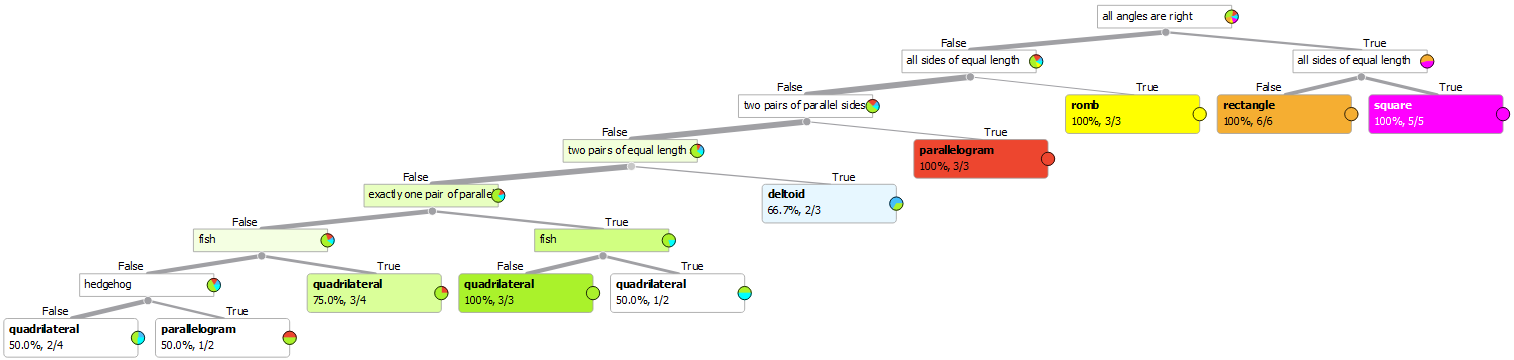
The Tree as Generated From the Data.
So what is going on here? Let’s see: the tree-building algorithm finds the rules to identify a square, rectangle, rhombus, and parallelogram without any problem, because for the most part, the students labelled these shapes correctly. Even with deltoids, it went relatively smoothly. Then however, the chaos kicked in – mostly caused by trapezoids, but also fueled by other wrongly identified shapes. In this part, the computer encountered shapes who, despite having completely identical characteristics, were labelled differently. What the shapes did differ in however, were the animal pictures they were accompanied by. Based on that, the computer concluded that this data must clearly be important for the identification of a particular shape – seeing as there really was no other difference!
This was instructive because we saw (just as we had suspected) that in the case that students commit errors, the upper part of the tree will still be correct, whereas in the bottom part, the tree will adapt to the errors. When a thing like this happens, it is best to use such errors to explain to the kids how these »smart« algoritms in fact operate and how stupid they actually are.
However, explaining something like this requires a teacher that is quite well-versed in AI. Since not all teachers can be expected to be experts in AI, we see that it will be necessary to compile as many examples of such potential complications as posssible, and cover them extensively in the teacher materials. Not ideal, I know, but still better than having teachers find themselves in situations where they get lost, not knowing how to explain to the students what is going on.
Another option would be to simply get rid of the pictures of animals. In that case, the tree would contain a node along the lines of »such and such shape is sometimes a square, sometimes a trapezoid, sometimes…«. This too, would work just fine.
Had there been enough time, we could have paid more attention to observing which of the shapes labelled by the students got onto the worksheets, allowing us to notice any potential errors in labelling (or incorrectly identified characteristics). Unfortunately though, we ran out of time.
Google Spreadsheets Are Not the Best Idea. The geometric shapes were marked with numbers, and the first column of the table contained the numbers of the shapes, so that each group would be writing the shapes’ names into their own rows. We thought of everything, right? Yeah sure.
First problem: as the table’s first row contained the names of columns, and we numbered the rows from 1 on, the numbers of the rows (as numbered in the first column) did not match the numbers of the rows in the spreadsheet. So the children sometimes wrote into the wrong lines and got into arguments about who is messing up whose data.
But that wasn’t even the worst part. All the school tablets had the same user, which threw Google off completely – the rows of the table were shifting and moving out of control. Awful. Frustrating.
It is completely possible that at least some of the incorrect labelling was the result of this confusion.
There are three lessons in this story:
- The shapes need to be numbered from 2 onwards. Then the column with the numbers is no longer needed. :)
- Browsers need to be opened in private (incognito) mode. In this way, the groups won’t accidentally »mess with each other«.
- Even better: don’t use Google spreadsheets. In the future workshops, students will enter the data into a »survey«.
Conclusion
Great job, Anže Rožman! This activity is really nice, and deserved to be the first one we tried out. But it will still need a few workshops to perfect it.
When you initiate a project like Pumice, one naturally worries – assuming you possess some degree of sensibility and critical self-reflection, whether this thing will work out. At least the author of this post certainly often has. After this experiemnt though, I’m a little calmer. :)