School Lesson: How Long Do You Want to Stay in School? Comparing Countries
The second activity was tested at the Secondary School of Economics in Maribor.
How Long Do You Want to Stay in School?
While for primary school students, going to school has to be the most awful thing in the world, university students try to prolong their studies (and along with that their stay at the Hotel Mom) by as long as they can.
In contrast, the responses of the secondary school students varied when asked whether they would prefer to continue their education or be done with it soon. So we clarified that in Slovenia, students are expected to stay in school for a certain number of years. I’m not sure how, but the students in Maribor even knew the Slovene average, which is around 12 years. Nevertheless, we decided to check it just to make sure it’s correct: using Orange, the students opened the World Bank data on Human Development Index, and looked for Slovenia. Yep, it’s true: the average time spent in school in Slovenia is indeed a good 12 years.
For those who don’t like school, maybe they should have simply been born somewhere else, right? Like… where? We answered this question using a histogram that shows the average length of schooling in different countries.
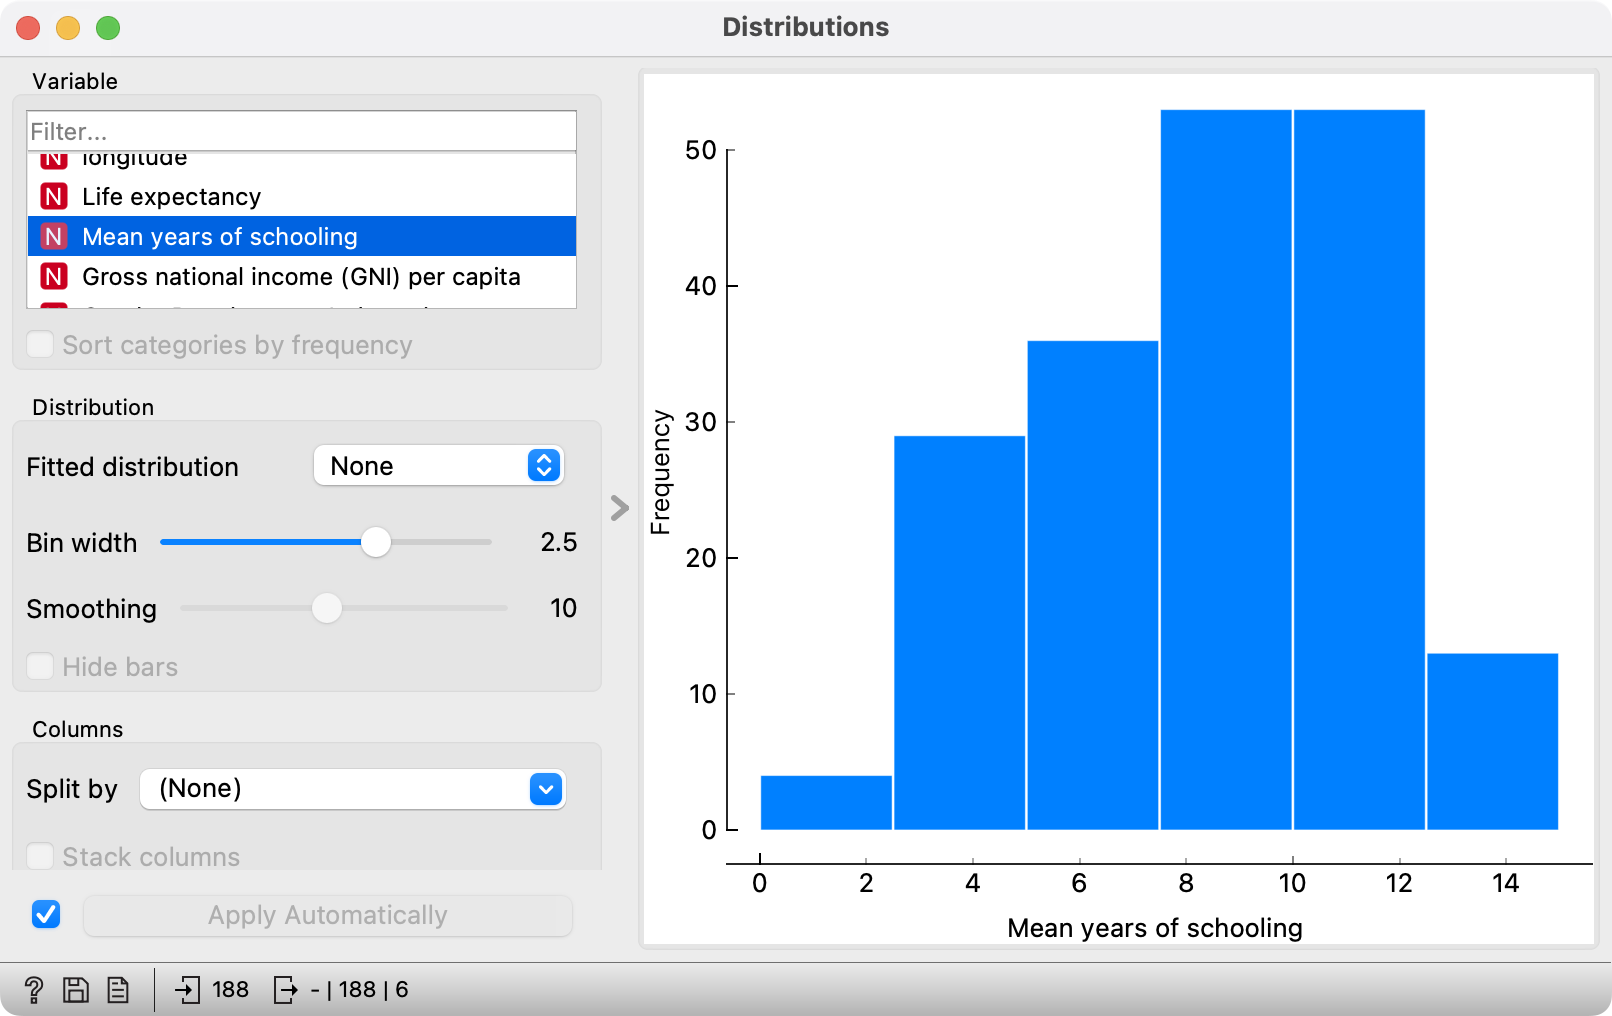
Histogram of the length of schooling by country.
We connected the histogram to the table and selected the first column – the one containing countries where going to school is practically not required. But neither Mali nor Burkina Faso particularly appealed to the students, so we checked the next column. This one too, contained only Africa and once again there was a general lack of enthusiasm, except for one student who really wants to travel to Senegal – a desire motivated by his passion for football.
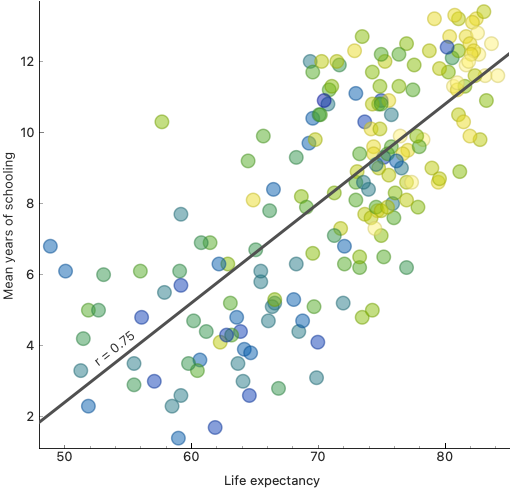
In this way, we came to the realisation that the population’s general level of education is probably linked to the general standard of living, such as the quality of the healthcare system. The easiest way to check this was by using a scatter plot to see the connection between the length of schooling and life expectancy in different countries.

Scatter plot: life expectancy in relation to the length of schooling.
The connection is practically linear: ten years more in school means additional forty years of life. So we proposed to the students the following deal: would you be willing to go to school longer, if that also meant four years more of life? A quick-witted student immediately asked: “When?” So we read her the fine print of the offer: you go to school now, and win the extra years of life when you’re old. »In that case, no.« was her reply.
I thought so. I too, would happpily accept three extra years of being twenty, and in turn attend some courses when I’m eighty. Or even lectures, if I had to. :)
The teacher, who knows both the students and the topic well, often jumped in with an extra question or two. But her comment in that moment was actually more important than anything the students had heard (or unfortunately most likely missed) in that lesson: »Well, you don’t have to. You already gain the extra years by living in Slovenia. The data is at the level of countries, not individuals.«
The students are smart, and they probably understood her remark. I’m not sure, however, if they thought further from there. Some have, some might, some never will: a high life expectancy in Slovenia is not a merit of each individual, but of society as a whole. This means that an individual can behave irresponsibly and not (necessarily) pay the price for it – at least not as high as they would in some other places. But if the irresponsible behaviour becomes too widespread, the society as a whole may have to deal with the consequences.
I find her remark so brilliant, we could easily just finish this blog right here. But let’s continue to give some insight into how the lesson proceeded.
Hierarchical Clustering in Person
We were interested in dividing countries into groups based on the quality of life, so we needed to – which was also the purpose of the lesson – get to know some procedures intended for this purpose.
First, we performed hierarchical clustering almost like »computer science without a computer.« On the floor, we imagined a scatter plot (next time, I need to remember to bring the packaging sellotape!). One axis represented the knowledge of mathematics, and the other one football skills. Within the graph, we placed seven students. Apparently, they were called Andrej, Benjamin, Cilka, Daniel, Ema, Fanči, and Gerhard, but we might have got some of that wrong while guessing the names. We might have also taken some wrong shots at guessing their skills, but either way, they were placed in the way that clearly formed three groups.
As people, we can »see« groups. But is there a way to also determine them with some formal procedure that could also be programmed? Sure, here’s how: we used a measuring tape (more accurately: VGA cable that was found lying on the desk; next time I’ll bring a real measuring tape) to measure the distances between all the pairs, and among them found two students that were most alike. We declared those two students to be a group, and in order not to forget that, the student that was standing further back, was asked to place one hand on the shoulder of his companion. We then found the next closest pair and put those two students in their own group. In a similar way pairs too, can be grouped together, and individuals added to groups. Of course, we’re talking about the process in general, in our case though, there were only seven students so the game soon came to an end. We stopped when the distance between two groups was nearly longer than an arms’ length, so the groups were »no longer possible« to be merged.
Country Groups
Following this physical explanation of the algorithm, the country data was fed into the hierarchical clustering widget, which identified groups of countries. Slovenia was in the company of Ireland (interesting!), and this pair joined a group including Slovakia, the Czech Republic, Hungary and Poland, all of which are part of a broader group of countries that include Central and Eastern Europe, as well as a smaller group that the students recognized as the Mediterranean countries, and among which Cuba sneaked its way in.
Wait, Cuba? Exactly, quite interesting, isn’t it? But isn’t Cuba some autocratic third-world country somewhere in the tropical heat of the Carribean? While some of that is true, it is definitely not »third world.« But what is actually the criterion we use to compare countries? When do we say that two countries are similar? What does the data entail? Level of democracy? Average daily temperature, amount of rainfall…? No, the dataset describes the quality of the education and healthcare systems, vaccination rate, gender equality and so on. And based on all these criteria that are said to objectively measure the quality of living, Cuba stands at a level akin to the European Mediterranean.
This too, I would say, is a valuable lesson. How about we stop judging based on stereotypes, and check data instead.
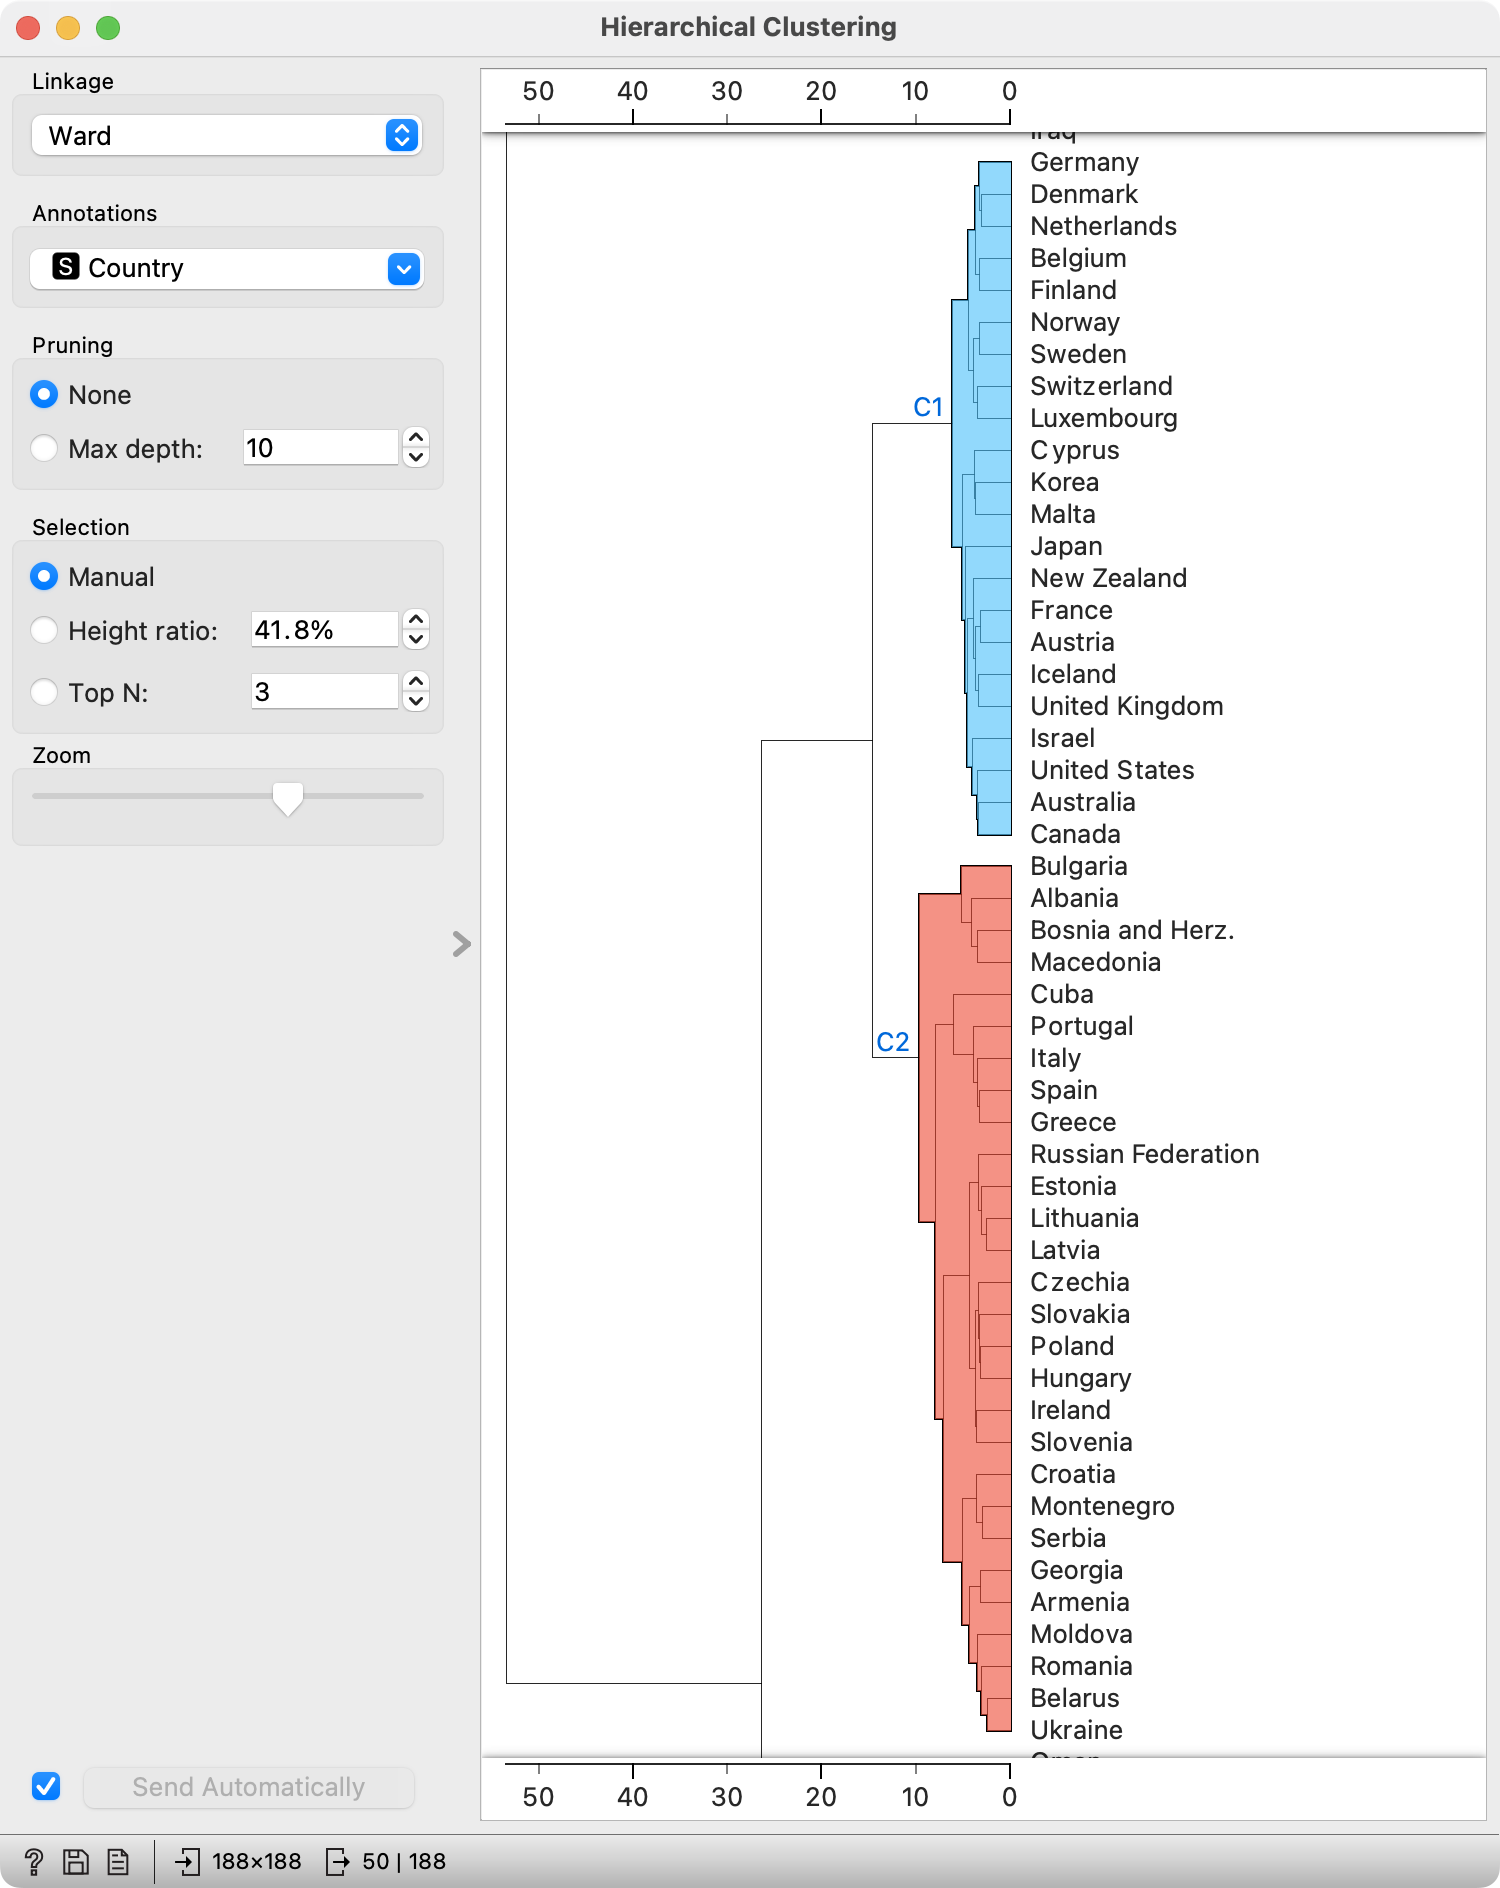
Subsets of more developed countries.
“Our” group of countries is then merged with another group, which contains Western Europe, North America, and other highly developed countries, such as Japan, Australia, and New Zealand. This group then forms one of the three major country groups in the world. The other two comprise one group that contains most of Africa, and the second one that contains South America and North Africa together with the Middle East.

Grouping countries into three clusters.
At the end of the lesson, the workflow chart we drew up together with the students looked like this:
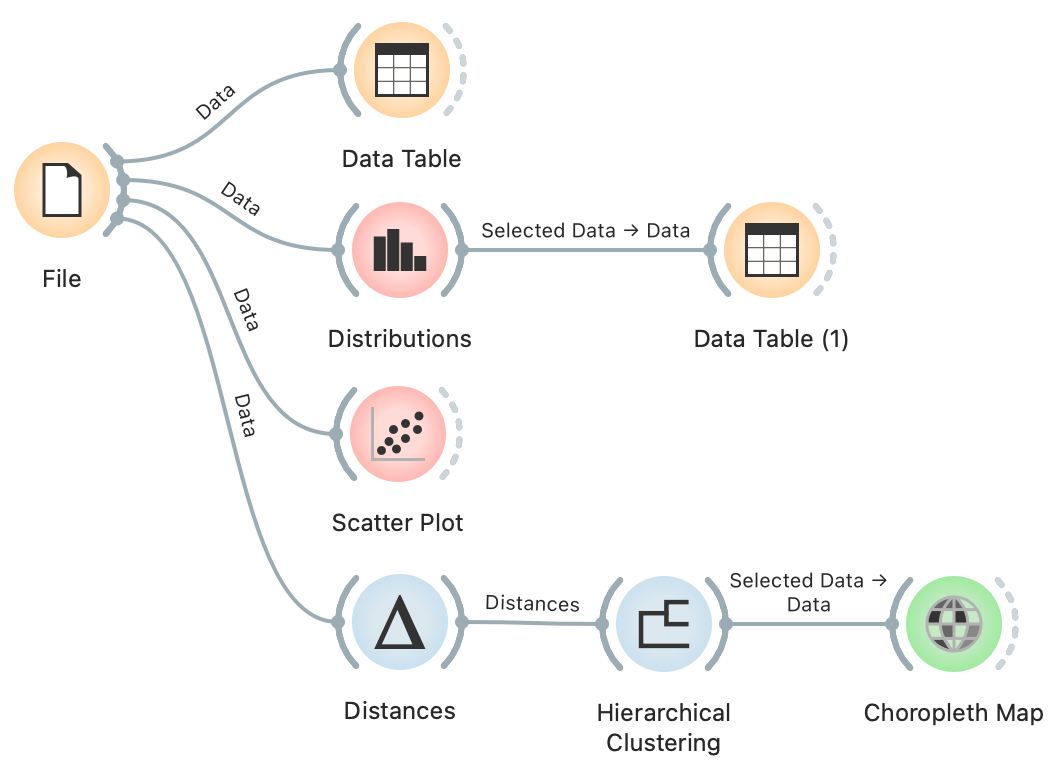
Workflow for analysing and clustering country development data.
What Have We Learned?
In this lesson, the secondary school students revised some geography; they actually know quite a bit of what us adults have already forgotten. They also learned something new about data analysis, but mostly, the students briefly saw how to use Orange. In fact, they were really good at it. Our experience from workshops with slightly older students is that they tend to get stuck quite often, and sometimes require a fair amount of help. With secondary school students though, It is very obvious they were born with a computer in their hands.
And what has this second school experiment taught us as the facilitators?
First, and most importantly: one lesson has – surprisingly! – proved to be almost enough. Still it would have been much better, if what we did had been done in two lessons, and if we could have analyzed country groups’ characteristics, the differences between individual groups, characteristics that place a particular country in the group it is in, and the characterstics that differentiate a country from other countries otherwise similar to it.
Where would we place such an activity? In the frame of Geography, it mostly served as a refresher, which is perfectly fine. However, as we found out during the lesson, the secondary school students had already done something similar before, albeit »manually.« In that case, this activity could also form part of a seminar, project, or something of that nature.
On the spot, we invented an activity along the lines of »computer science without a computer«, which we used to explain hierarchical clustering. Seeing as it was quite a success, we will continue working on it to refine it further, and provide a description of its design.
Final Remarks
Alright, let’s get a little personal. My main job is working with university students, but I also spend a considerable amount of time in primary school. I’m used to these two age groups; but when it comes to secondary school students, I just… find myself a little intimidated. I don’t know this age group well enough, and consequently feel unsure about what to expect. Will they be interested, will they follow, will they participate? Or are we just looking at one major, 30-headed behavioral challenge waiting to be unleashed?
I have to say the students of the Secondary School of Economics in Maribor were great. Smart, responsive, and a perfect balance between serious and fun. No doubt the school has played a significant role in that – the beautifully designed building, but mostly its devoted teachers and principal, who we had a brief chat with at the end of our visit.
Oh, and just to say, when we promised to happily return in the future, we were not just being polite.