Discovering Animal Groups
The purpose of the lesson is to learn or practise how to read dendrograms that show hierarchical clustering. Ideally, this activity should follow the one on Hierarchical Clustering, ensuring that children are already familiar with clustering concepts and dendrograms.
Dividing Animals into Groups
Divide students into groups.
Tell them the following true story.
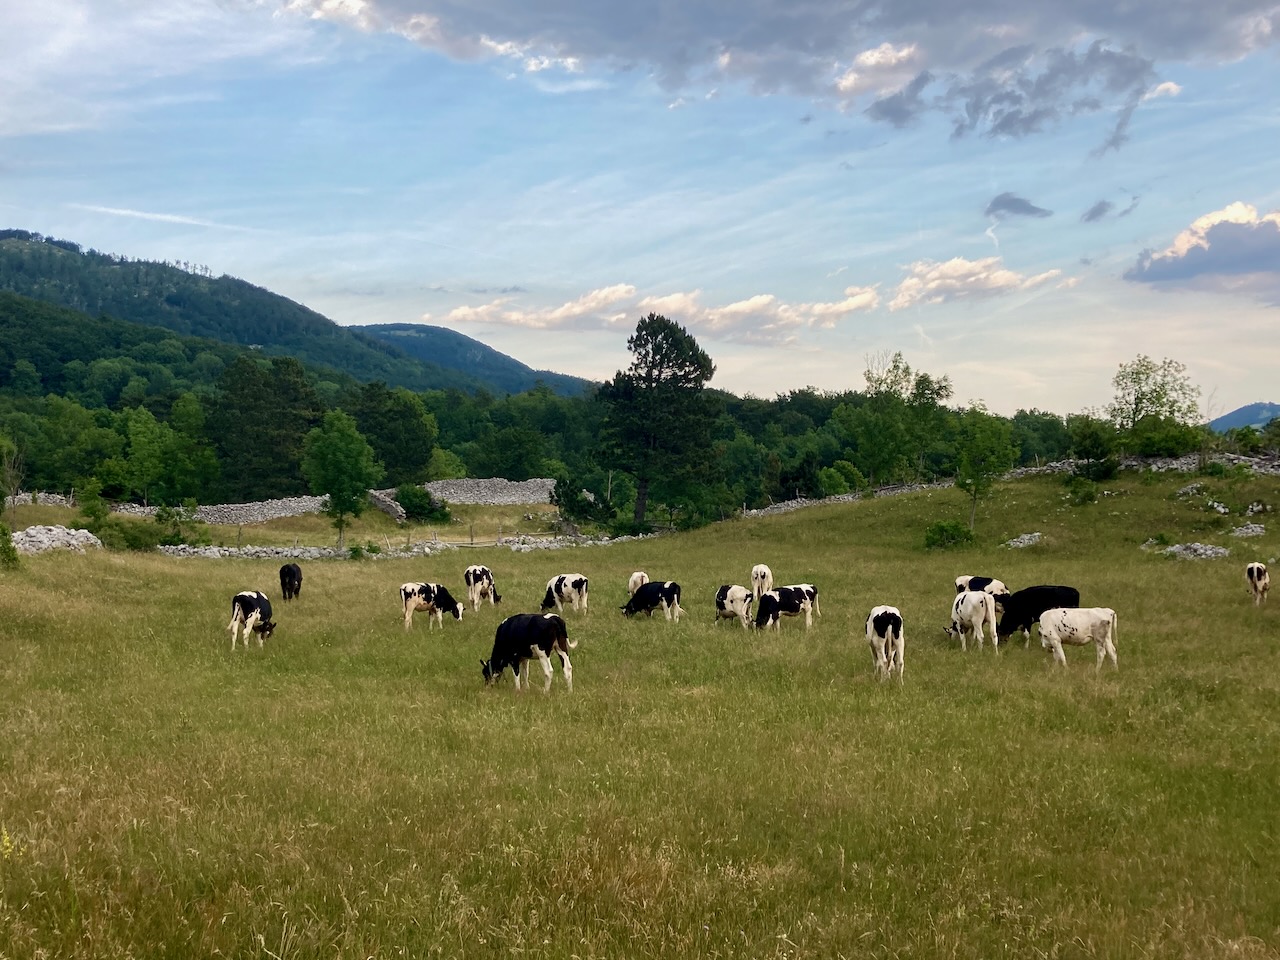 Invisible Martian (not) spotted collecting data on cows near Ajdovščina, Slovenia.
A Martian called Charlie (his real name is actually different, but since Martian names are a little complicated, let’s just call him Charlie) secretly landed on Earth to do a research project about our animal world. He walked around invisible (as any sensible person can tell, Martians are invisible, since no one has ever seen them) and collected data on a hundred different animals: for each animal, he wrote down whether it lays eggs, flies, has feathers, a tail, breathes with lungs, mostly feeds on other animals (he called such animals “predators”), and so on.
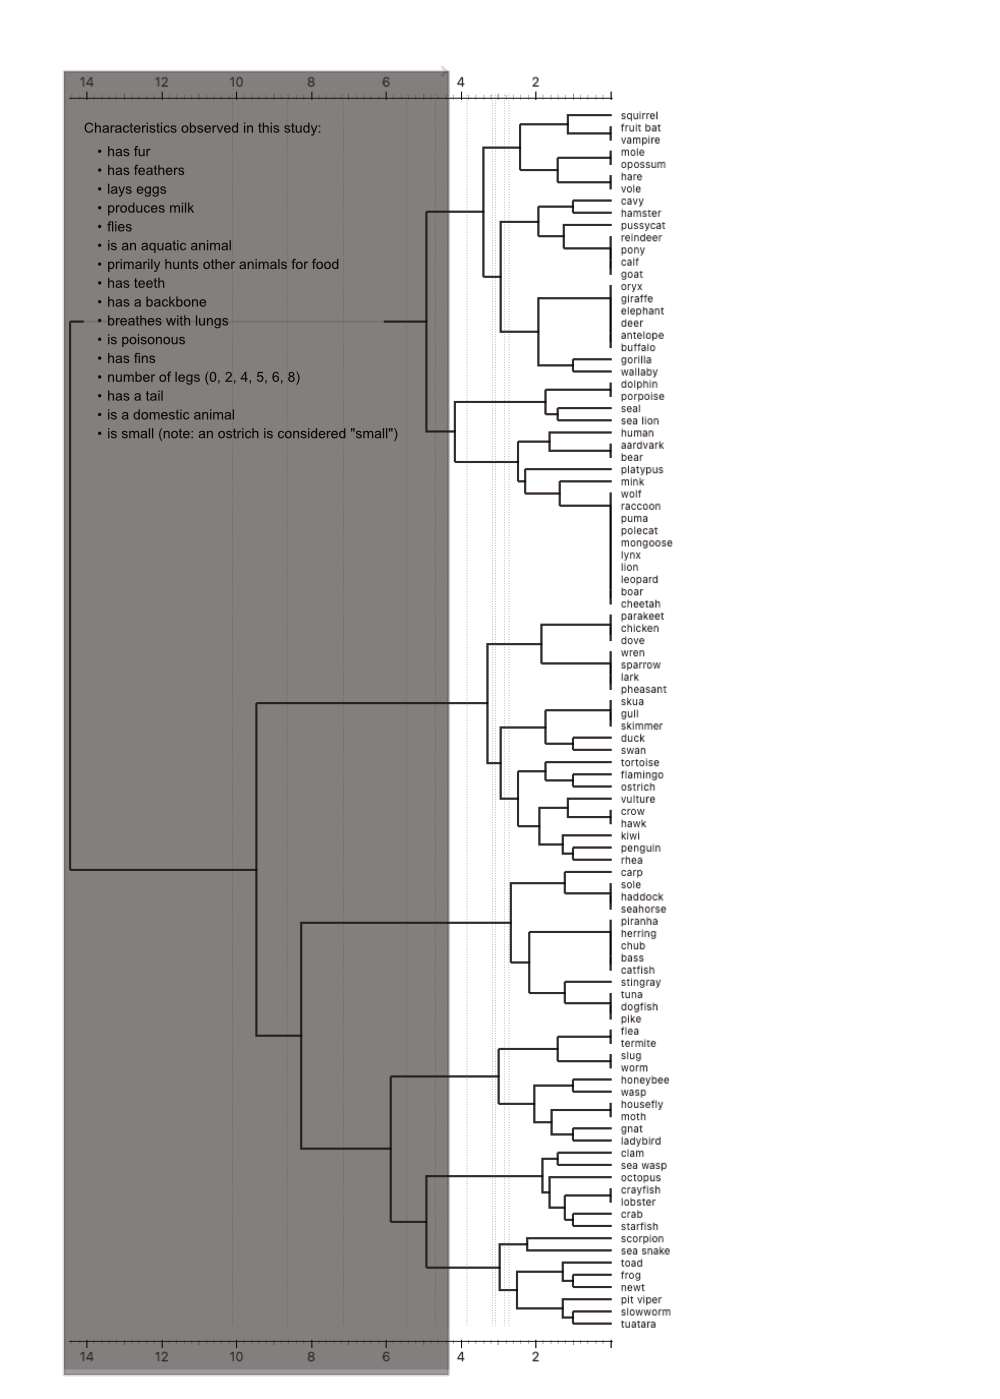
Charlie’s goal was to divide the animals into meaningful groups. With the help of a computer, he got an animal tree that looks like this. [Show the students the sheet with the dendrogram.] In the tree, we can see that each animal is first a group on its own, and they are then progressively grouped together into larger and larger groups, until they are all finally part of the same big group. That last stage is of course pointless, so Charlie needed to decide at what point to stop the merging process, i.e. how many groups to keep. He decided that seven would do, since he heard that is also how humans do it. [Is that correct? This is the perfect time to revise the animal groups together with the students and write them on the board. What Charlie had in mind was probably the classification of animals into mammals, birds, insects, reptiles, amphibians, fish, and other “invertebrates”.]
Now, we show the students how to identify the groups on the dendrogram. We do this by covering the left part of the sheet with another sheet of paper (or a ruler, or something similar), up to the first dashed vertical line. In this way, the tree gets divided into two (on the visible part of the sheet) separate subtrees.
If we cover everything up to the second dashed line, we get a division (clustering) into three groups.
We distribute the dendrograms to the groups of students. Each group should figure out how much of the sheet to cover to get seven animal groups. Check their work. (The correct division goes along the sixth line from the left, the one just left of the point marked 4 on the scale. This divides mammals into two groups - the kangaroo and the dolphin must be in different groups. The same goes for the scorpion and the starfish. Sea lion and human remain together in the same group.)
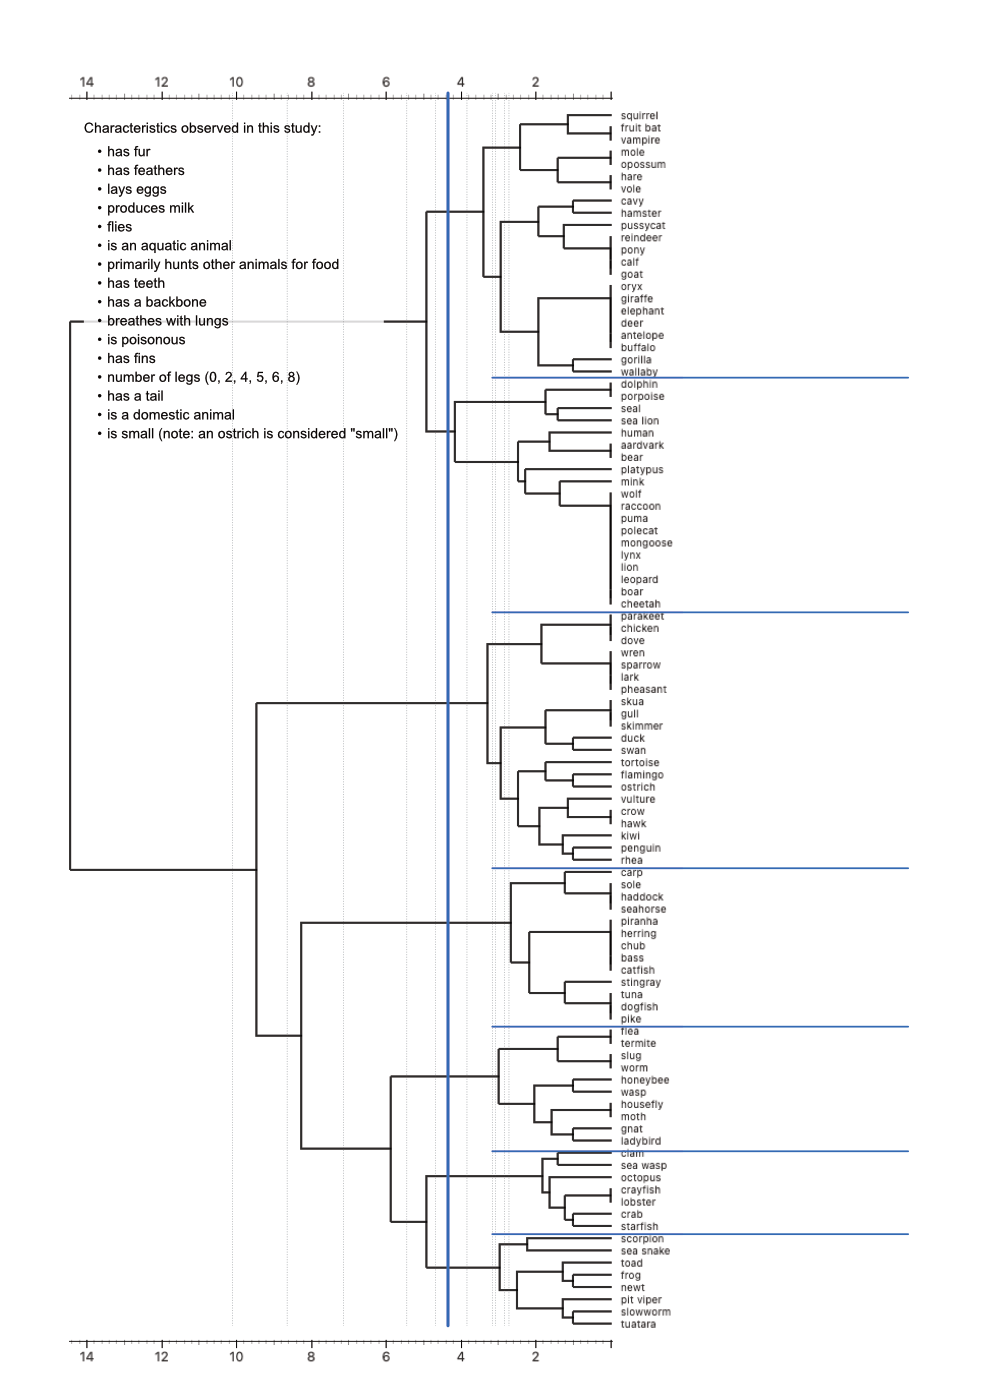
Instruct the students to mark the chosen threshold line and to divide the groups by drawing horizontal lines between them.
Discovering Groups
We would like to find out if in his independent research, Charlie discovered the same groups as the ones we learn about in school. To do this, we shall first look at each of his seven groups and see what types of animals it contains.
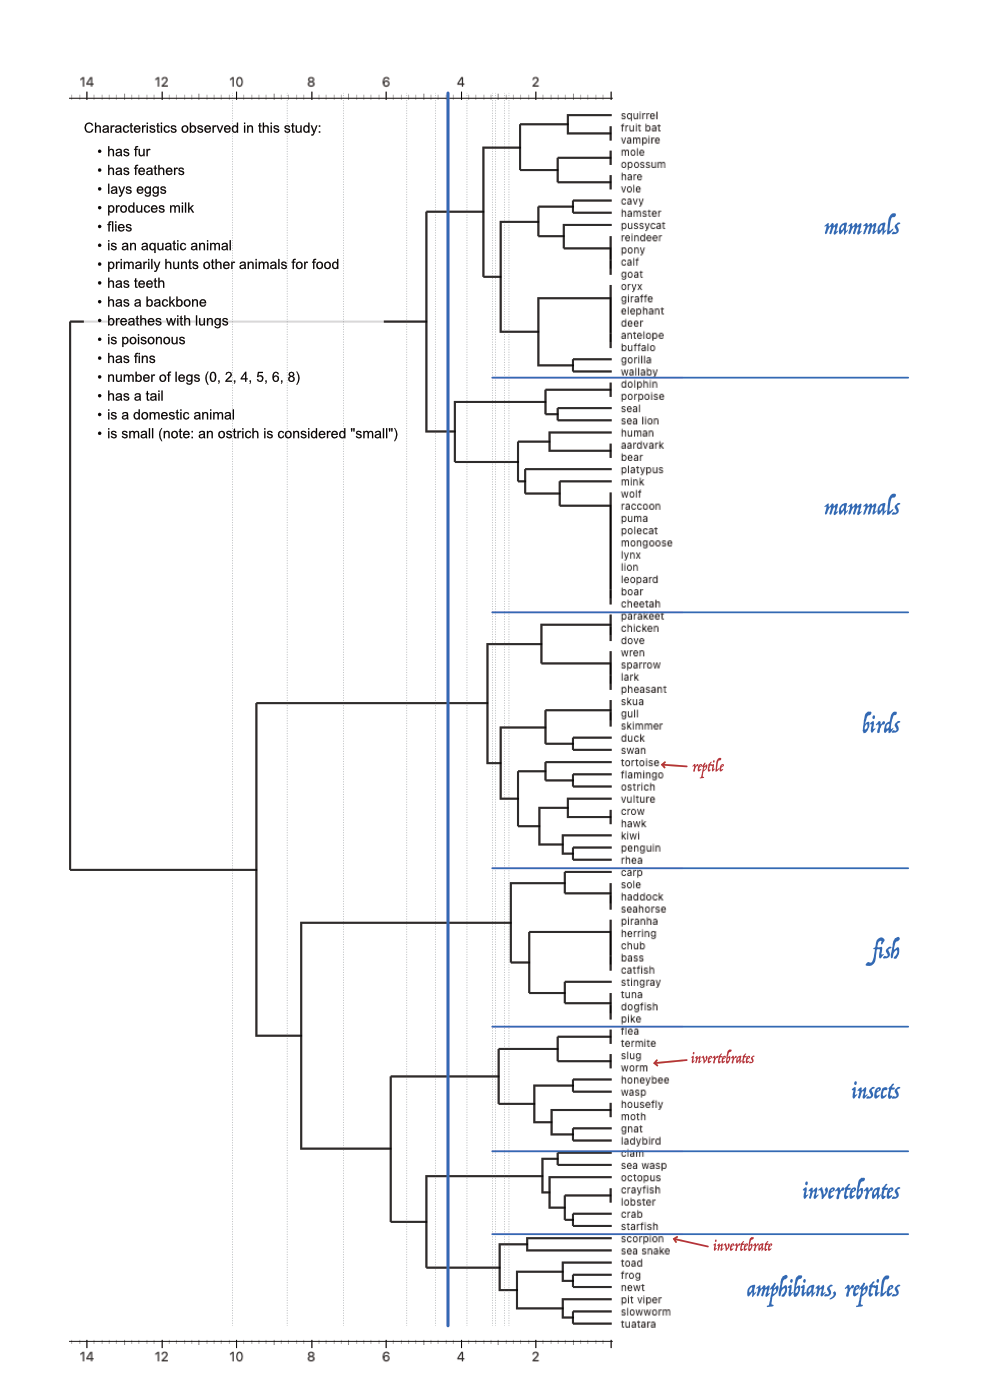
Ask the students to label each of Charlie’s seven groups with the predominant type of animals within them (mammals, insects, fish, and so on). They should note the following:
- Some groups may include animals that don’t quite fit. If a group is made up almost entirely of birds but contains the occasional amphibian or fish, we will still classify it as a bird group. Ask the students to highlight the animals that don’t belong and write a note which group they should be placed in instead.
- Some groups may actually be mixed – for example, Charlie’s method might have combined fish and amphibians. In such cases, students should note that the group contains both.
- A specific animal group may appear in more than one of Charlie’s groups. For example, he might have split birds into two separate groups. In that case, students should simply label both groups as “birds.”
The students will find that the first two groups contain mammals, the third contains birds, the fourth amphibians, the fifth insects, the sixth invertebrates, and the seventh a mix of amphibians and reptiles—along with one unexpected guest, an invertebrate.
There are only a few outliers, and they are easy to spot.
Error Analysis
Can the students identify the difference between the two groups of mammals? Encourage them to refer to the animal characteristics listed on the right to help with their observations.
Mammals are separated based on whether they primarily sustain themselves by hunting other animals. This is not a division into carnivores and herbivores; they are separated only based on their typical diet.
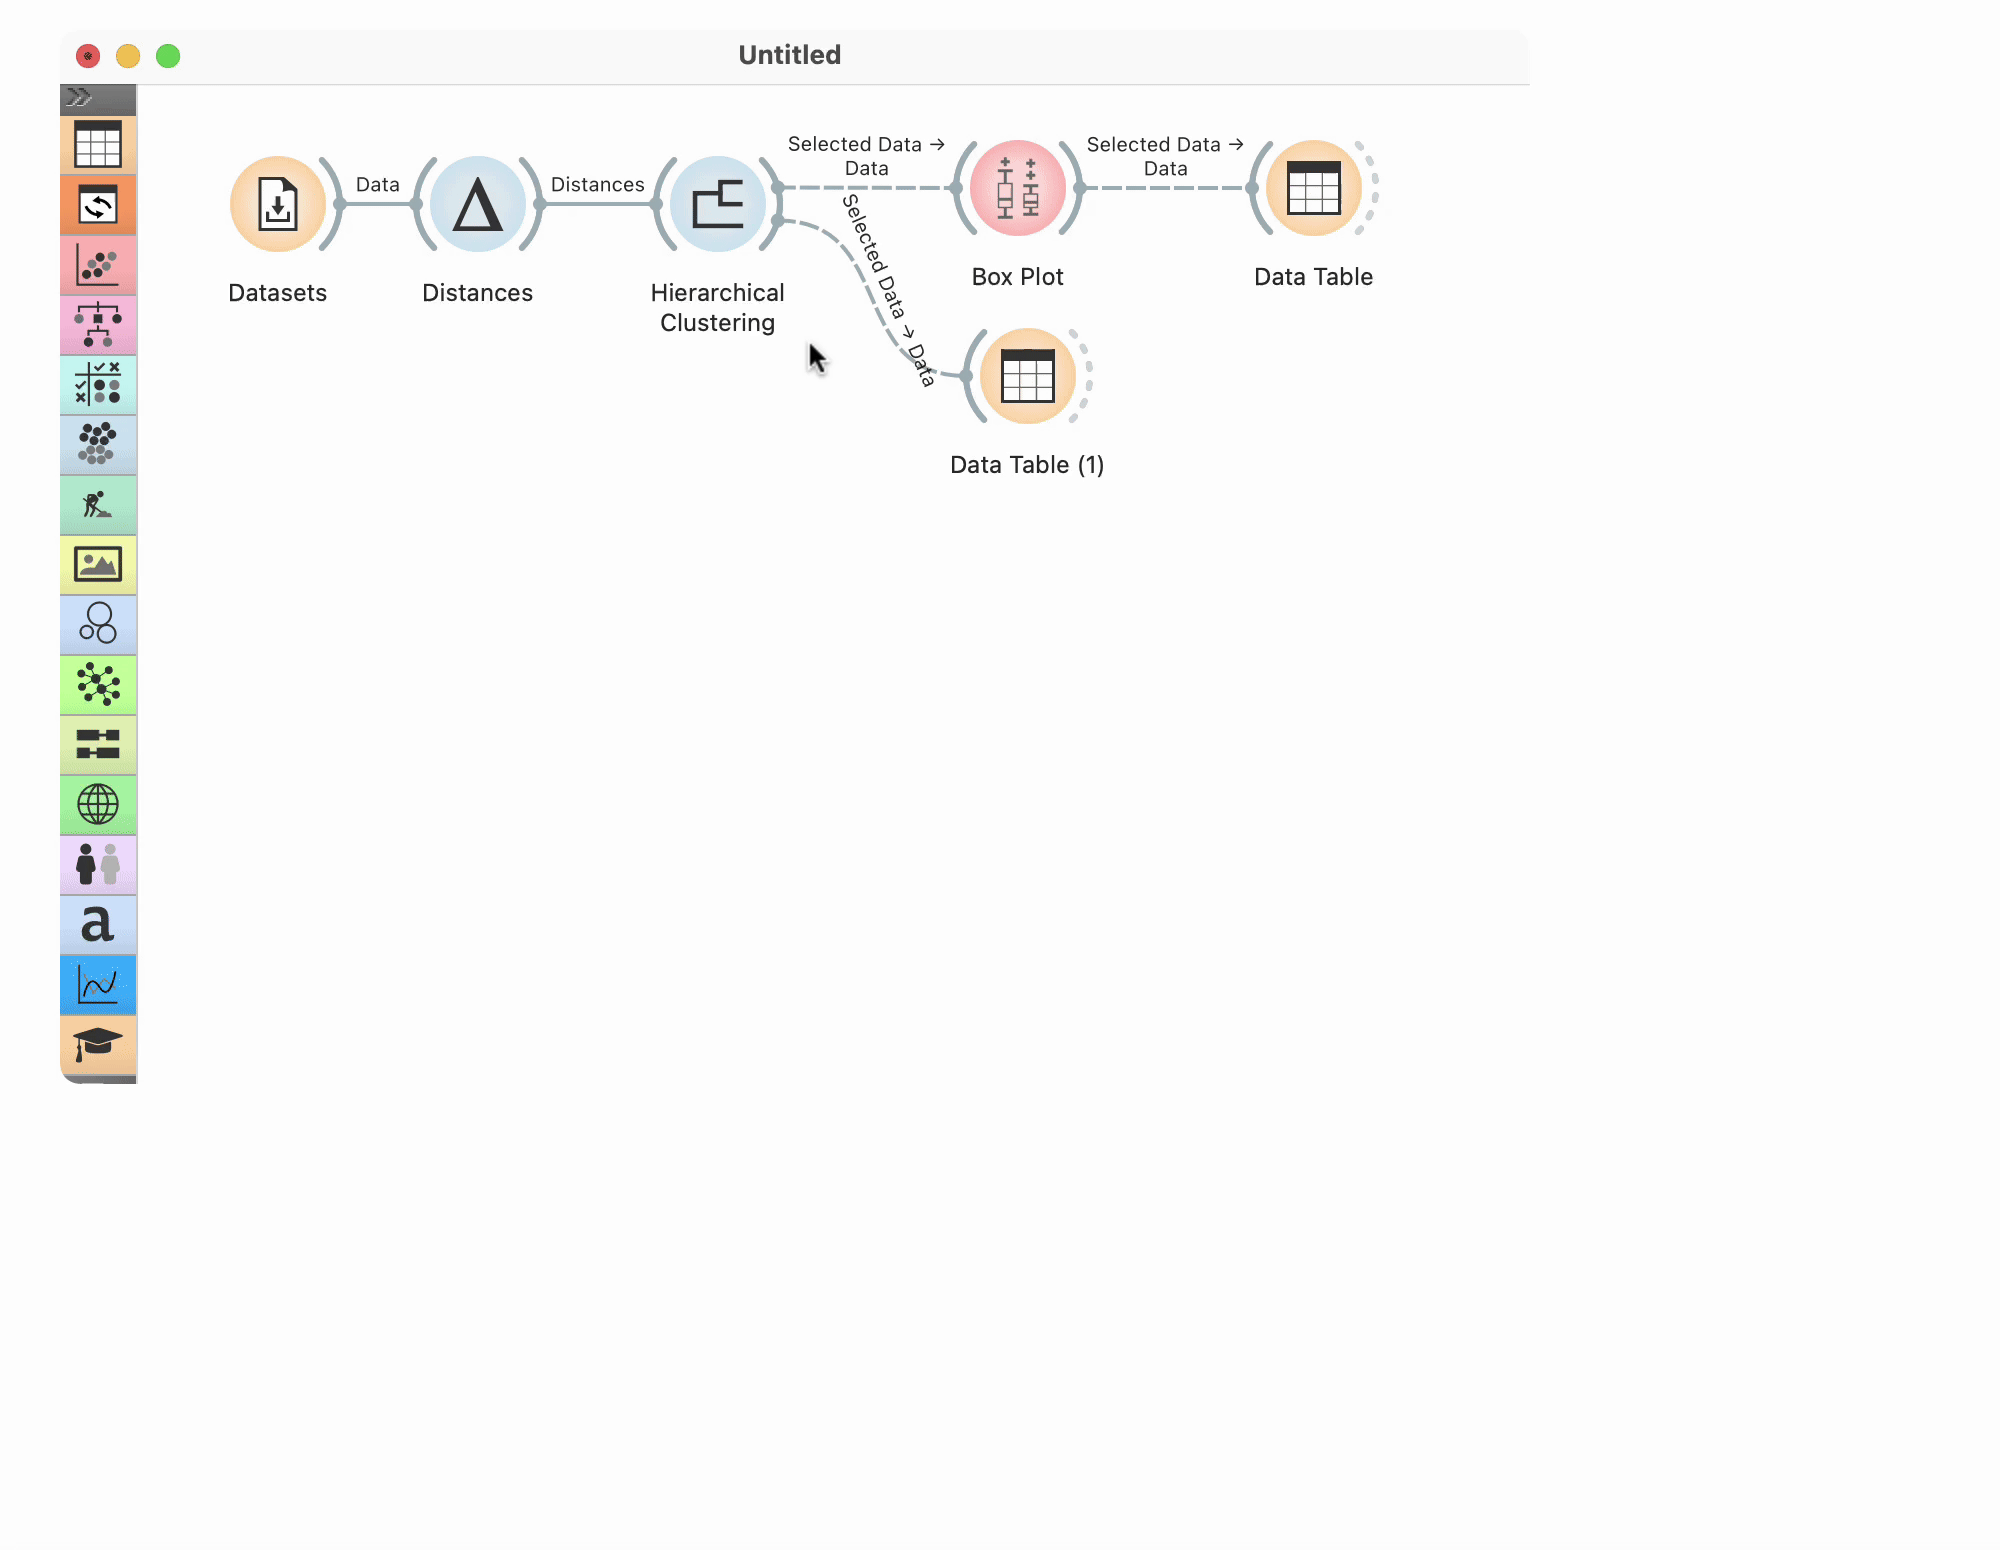
If you’d like, you can help the students find the answer to the question above using the computer, or you can do this later after they have discovered the answer on their own. Open the premade Orange workflow.
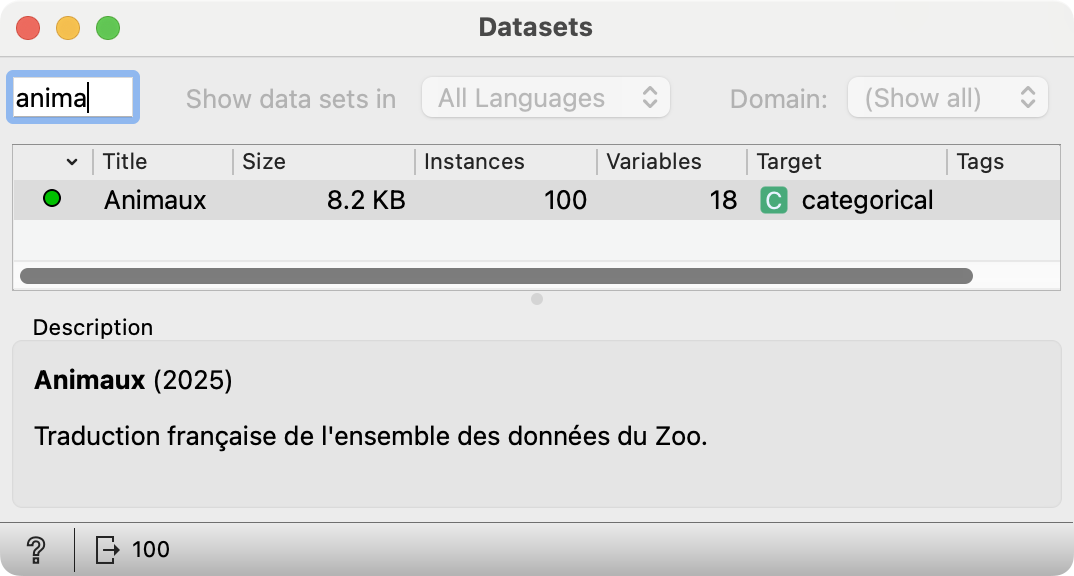
For French or German names, open the Datasets widget, start typing “animaux” or “tiere” in the filter box at the top left, and double-click the corresponding dataset.
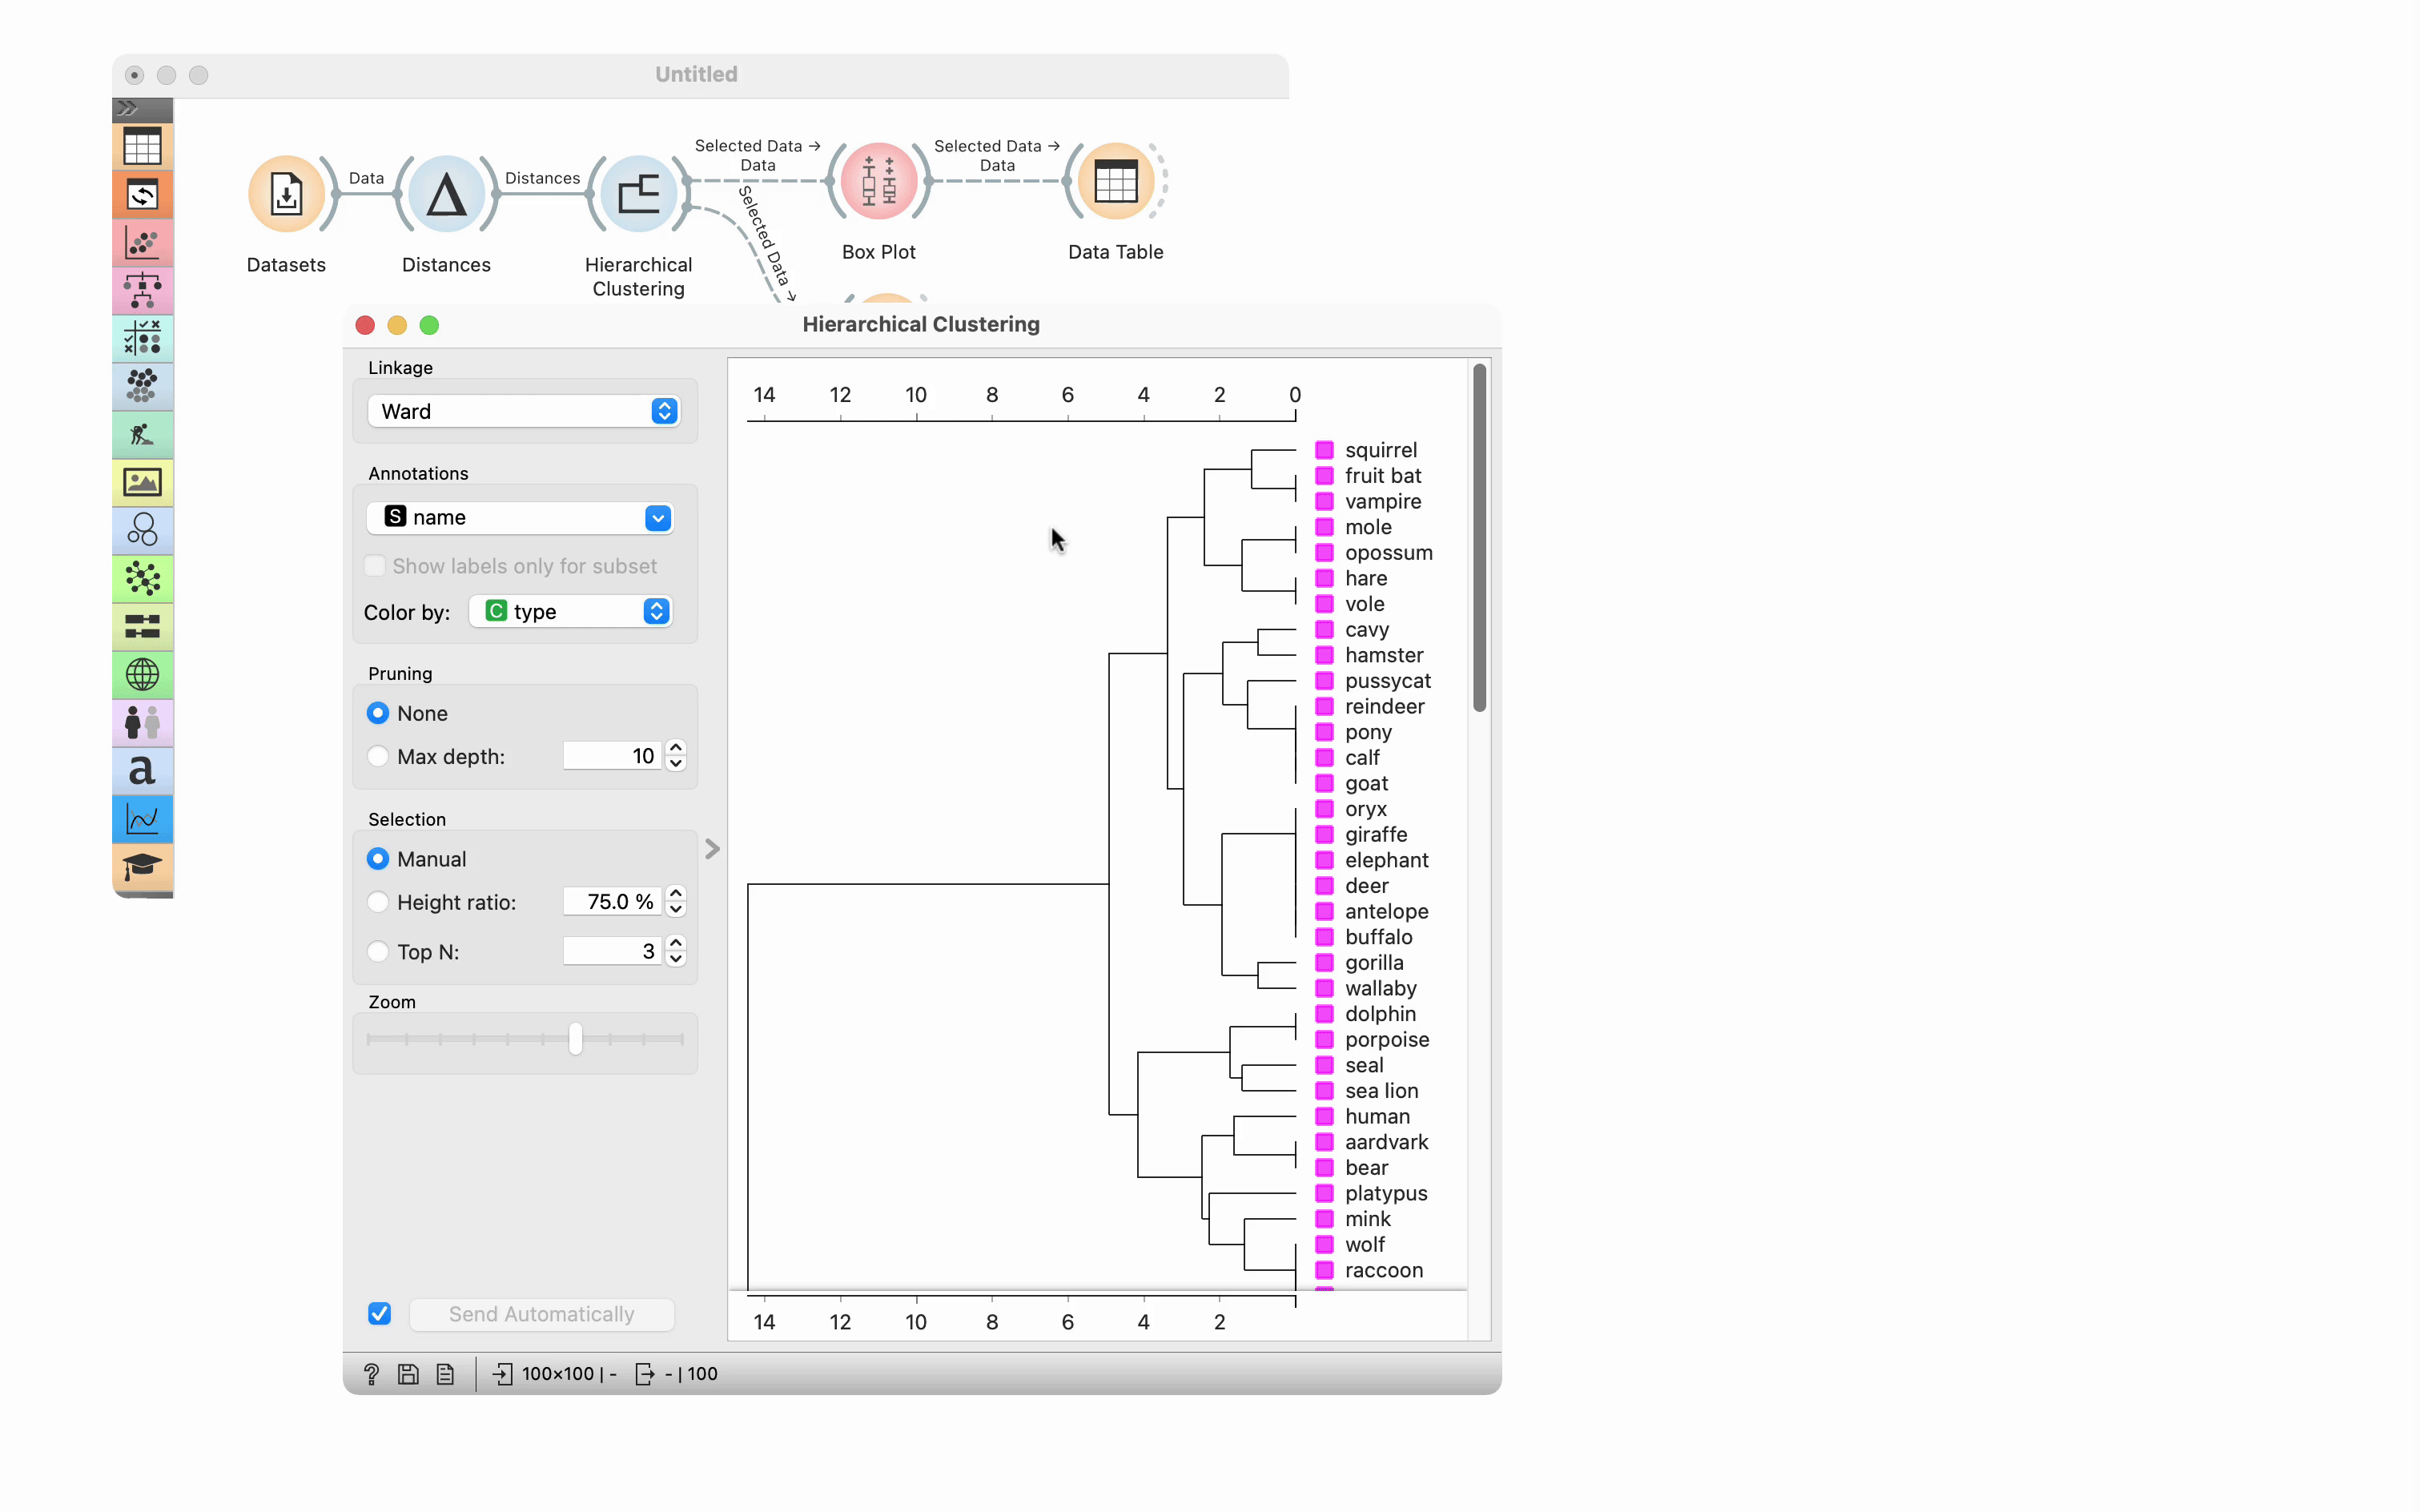
Now let us explore the clustering.
- Double-click to open the Hierarchical Clustering widget. In the widget, the Colour should be set to “type”, so we can better see how well the “real” animal groups match Charlie’s.
- In Hierarchical Clustering, select both groups of mammals: first, click inside one, then press Ctrl (Cmd on Mac) and click inside the other group.
- Double-click to open the Boxplot widget. In Groups, select Cluster. Make sure that “Order by relevance to subgroups” is enabled. At the top of the list of variables, we see the characteristic based on which the selected clusters (mammal subgroups) differ most, i.e. Predator. That information tells us whether the animal primarily feeds on other animals.
- Let’s click on “Predator”. We can see that the second cluster contains predators only, while in the first cluster, there are just a few. (So why did they end up there? Because they differ from the animals in the second cluster based on other characteristics.)
- Click on the part of the graph that represents the predators from the first cluster.
- Open the Table widget (the one connected to the Boxplot), where we can see the specific animals we are dealing with: a mole, an opossum, and a cat. (What kind of animals are opossums? The students might know them as the little mischievous pair from the Ice Age cartoon.) Moles and opossums enjoy insects (as food, not company), while cats are known to have their whiskers twitch at the sight of a mouse, bird, fish, or other savory prey.
Erm, excuse me, but what on earth is a tortoise doing grouped together with an ostrich and a flamingo? We can ask the students to help us find an explanation, and then revise the criteria together: in how many features does a tortoise differ from the other two animals? It is only different from those birds based on two things: a tortoise has no feathers, and has four legs. Looking at their flying skills however, a tortoise is no different from an ostrich (just for different reasons). (Our very intelligent Copilot assistant commented: “An ostrich is too big to fly, while a tortoise is too slow.” Let’s take this chance to discuss the real reasons with the students.)
If we want to get to the right answer (also) by using the computer, we open the Hierarchical Clustering widget once more.
- Click inside the part of the tree that contains the frog, the ostrich, and the flamingo.
- Open the second Table widget. You can see the data for those three animals.
- In the table, observe the differences between the animals by scrolling to the right.
In a similar way, we can find out what the slug and the worm have in common with fleas and termites. As it turns out: everything except the number of legs.
It would make sense to also want to discover why the scorpion ended up grouped with the sea snake, but we would not really find a sensible answer. A scorpion is simply too different from other invertebrates; out of all the animals (or animal groups) that the clustering process compared it to, it was the most (although still not very) similar to the sea snake.
Conclusion
In the final part, it is interesting to discuss the topic from the perspective of biology, but if we feel confident enough, we can continue discussing computers some more.
How successful was Charlie? Did he discover the correct groups of animals?
It all depends on how we define the right groups. What Charlie got were groups aligned with the characteristics that he observed. Do these characteristics (properties) make sense? He could add others, for instance, whether he likes the animal, whether it makes a pleasant sound, whether it has an unpleasant smell, etc. However, biologists would argue that those characteristics are meaningless. They would further argue that the size of an animal and whether it is domesticated or not are just as irrelevant for the correct classification.
Nevertheless, Charlie’s groups match the real animal classification groups quite nicely. But he had some issues.
- In Charlie’s data, mammals are a large group, so it’s not surprising that they differ from each other so much that clustering divided them into two groups. Every clustering process performed by the computer has its whims, and many tend towards forming groups of similar size.
- Charlie aimed for seven groups because he heard that is how humans do it. So since mammals took up two groups, the computer needed to merge two other groups. That is why amphibians and reptiles ended up in the same group.
- Charlie’s computer placed the tortoise (a reptile) in the bird group. There were only a few reptiles and most likely, the tortoise was not similar enough to any of them, especially after the reptilians teamed up with the amphibians.
- And then there are “other invertebrates”. This poorly defined group is too diverse. A cluster in Charlie’s distribution was already taken up by sea animals that have more traits in common, while the snail, the worm, and the scorpion ended up being more similar to other animals than to the marine invertebrates.
The computer doesn’t know what a tortoise or an ostrich is. In the same way, it doesn’t know what a slug or a flea are either. It only knows the characteristics that we provide it with, and if based on those characteristics, a slug is most similar to a fly, the computer will conclude they belong together. No one told it that one of those animals leaves its slimy trails on lettuce, while the other prefers dogs and cats.
Finding groups (clusters) is an important part of exploring data and looking for patterns in it. We use this method when we sense that the items (in our case, animals) we are observing can be divided into some kind of groups, but have no information on what those groups might be. It would, of course, make things easier for Charlie if he got his hands on the correct animal classification data (wait, do Martians have hands? Never mind, how would we even know that, since they’re invisible anyway?). Anyway, in that case, Charlie would not need to use clustering. He could develop a model that would predict the type of each animal based on its features. (We actually do that in another activity called Animal Tree.)
In the conclusion, we can tell the students that Charlie the Martian was actually a real person. And - ha! - it is not Charles Darwin! He was not a Martian either, but Swedish. But his name does actually sound really similar to Charlie. The man was called Carl Linnaeus. Later in life, he was also given the noble title Carl von Linné, but he mostly wrote under the Latin name of Carolus Linnæus or Carolus a Linné. See why we decided it’s easier to just call him Charlie? Linnee is the father of modern taxonomy of organisms. He lived 250 years ago and solved problems similar to those of Charlie from our story: he observed animals, decided which characteristics are important for their classification, and then group them based on those characteristics. Of course, the real Charlie did not have a computer to do that, neither did he form groups “blindly” like the computer does: seeing a turtle grouped together with an ostrich would have most definitely made him raise an eyebrow.
- Subject: Mathematics, Biology
- Duration: 15-25 minut
- Age: Any
- AI topic: Clustering
- Materials
- Preparation for the lesson
- 🖨️ Print this page
- Printed dendrograms, preferably A3 size for easier reading; one per group of students
- Computers with the Orange software installed
- Further explanation