Discovering Animal Group Characteristics
Several things happen in this activity. Students
- observe the properties of individual groups of animals with appropriate visualizations,
- learn how to use the Orange environment, especially how to select subsets of data,
- discover the idea of classification trees as independently as possible (as we would call an animal key in artificial intelligence) and build such a tree,
- repeat and refresh animal groups (mammals, insects, fish…).
In the related activity Animal Tree, the focus is on building a tree; it is intended for younger students and conducted as a whole-class activity. This activity places more emphasis on data analysis (which ultimately leads to a classification tree), making it suitable for the upper primary level. Ideally, it is carried out with students working individually or in pairs on computers.
Although — as with other activities — the final workflow is published on the website, the intention here is for the teacher to build it step by step, with students following along or, at certain points, completing and using it themselves.
Reading and Exploring the Data
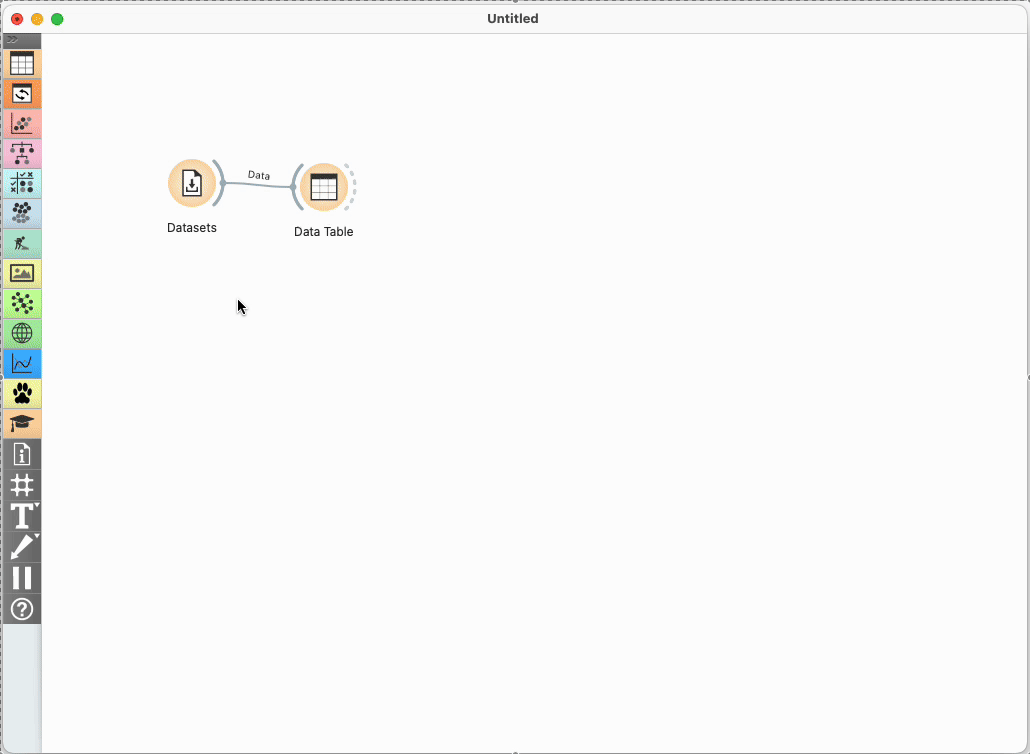
Add the Datasets widget to the canvas and open it with a double-click.
In the Datasets, search for the dataset Zoo - with missing data (start typing “zoo” in the top-left search field) and double-click it. The widget will load the data from the web.
Connect the dataset to the Table widget so we can view it.
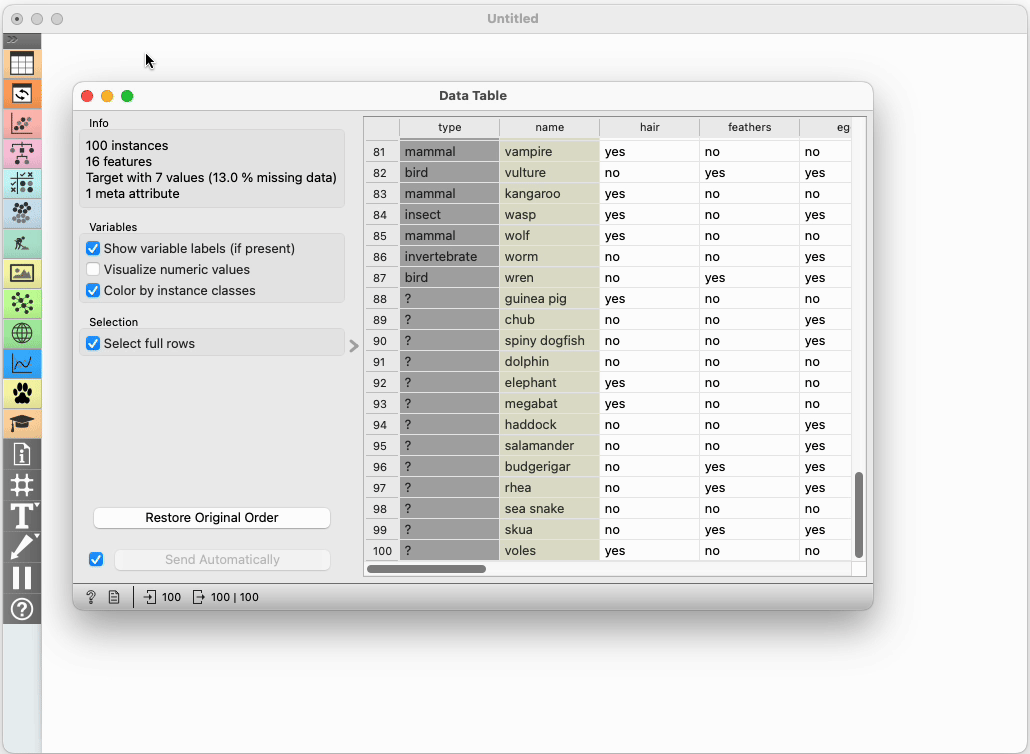
Browse through the table. It contains information about various animals and their phylum — mammal, amphibian, insect, and so on. We already know that bears are mammals and crows are birds, even if we are not that the former do not lay eggs and the latter can fly.
At the end of the table, we find animals that haven’t been classified. There’s an elephant, which we know is a mammal (because of its trunk? Maybe not. 🙂), and even if we’re not sure where to place the skua, we quickly notice it has feathers, so it must be a bird. How do we know that? Well, we just know that birds have feathers.

Working with Unknown Data
We already know a lot about animals, since we study them regularly. But when we analyze new data, we first need to acquire that knowledge. Can you imagine having only data about animals (that we don’t yet know) and their features—without knowing what is typical for each group?
Go back to the Data Table widget and load the dataset Animals in Finnish. (If you previously typed “ani”, it should already appear—just double-click it.)
Return to the Data Table: everything we saw earlier is now in Finnish. This is how it feels when working with new data we know nothing about.
In one classroom experiment, we told students they had landed in Finland, where a cruel dictator had thrown them in prison and handed them a list of 87 animals—with names, traits, and types in Finnish—threatening to cut off their heads unless they correctly classified the 13 animals at the end of the list by morning. (The story doesn’t make much sense—why Finland, and why would a dictator care about such things?—but it turned out to be quite effective. 🙂) Does sopuli belong to lintu or maybe nisäkäs, just like huonekärpänen is a nisäkäs?
Before we learn how to analyze completely new data, we’ll return to the English version — it’ll be easier that way. In the meantime, we’ll keep the Finnish data in mind and pretend we don’t even know what bird or feathers are, as if we had never heard these words before. We’ll have to figure out from the data itself that feathers are a characteristic of birds. First, we’ll build an animal key using English words, and then we’ll do the same with the Finnish ones.
Observing the Data and the First Split
We need to determine what is typical for each animal group.
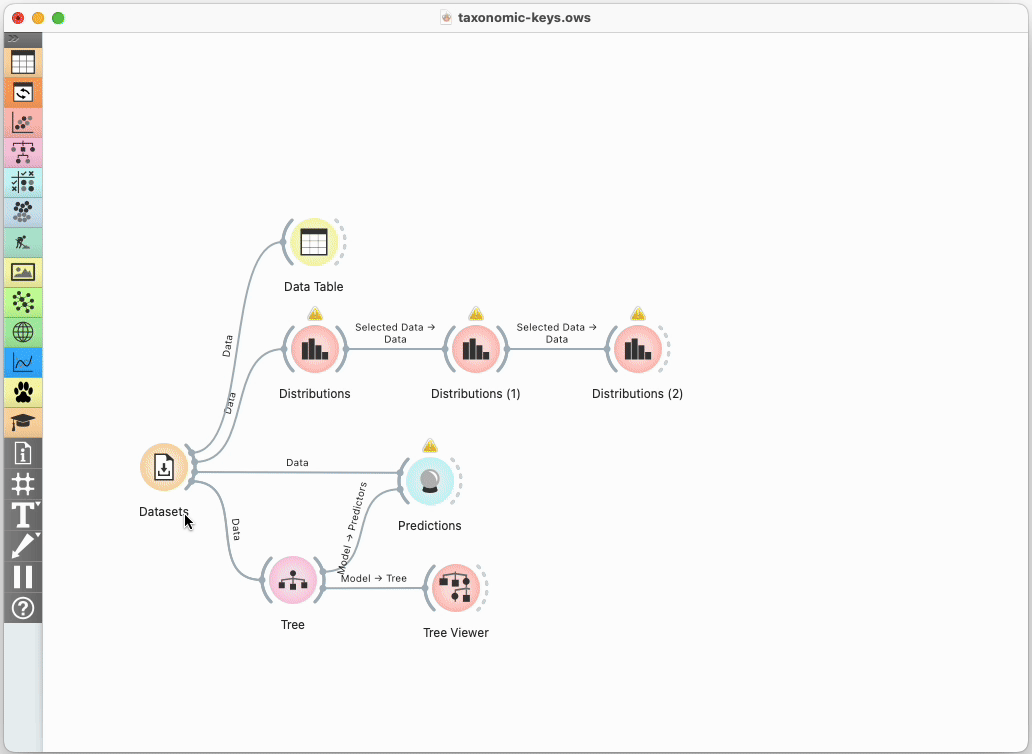
Connect the data to the Distributions widget.
In Distributions, select type as the variable and split the columns based on different features. This allows us to see, for example, how many animals in each group have teeth.
But if we want to build our own classification key to distinguish between groups, it makes more sense to flip the view: split the data by type, and choose various features as variables. For instance, we can see that teeth are common among fish and mammals, but not present in birds, insects, or invertebrates.
Together, as a class, we look for a feature that best separates one or more groups from the others by clicking through different criteria. We might divide animals by whether they can fly, have hair, and so on. A good feature is one where each group clearly falls on one side or the other. For example, do they have feathers? All birds have feathers, and no other animals do. So, feathers are a good way to distinguish birds from other animals.
Let’s say we choose milk. In that case, we draw the beginning of a decision tree on the board—“gives milk?” On the “Yes” branch, we write Mammal; the “No” branch will continue further.
Splitting Further
In the Distributions widget, select “No.” This will pass only the animals that do not give milk to any widget connected to its output.
Connect another Distributions widget to it. This new widget now contains only animals that don’t give milk—you can quickly verify this.
Now we can search for a new feature to split the remaining animals. For example, do they have feathers? Teeth?
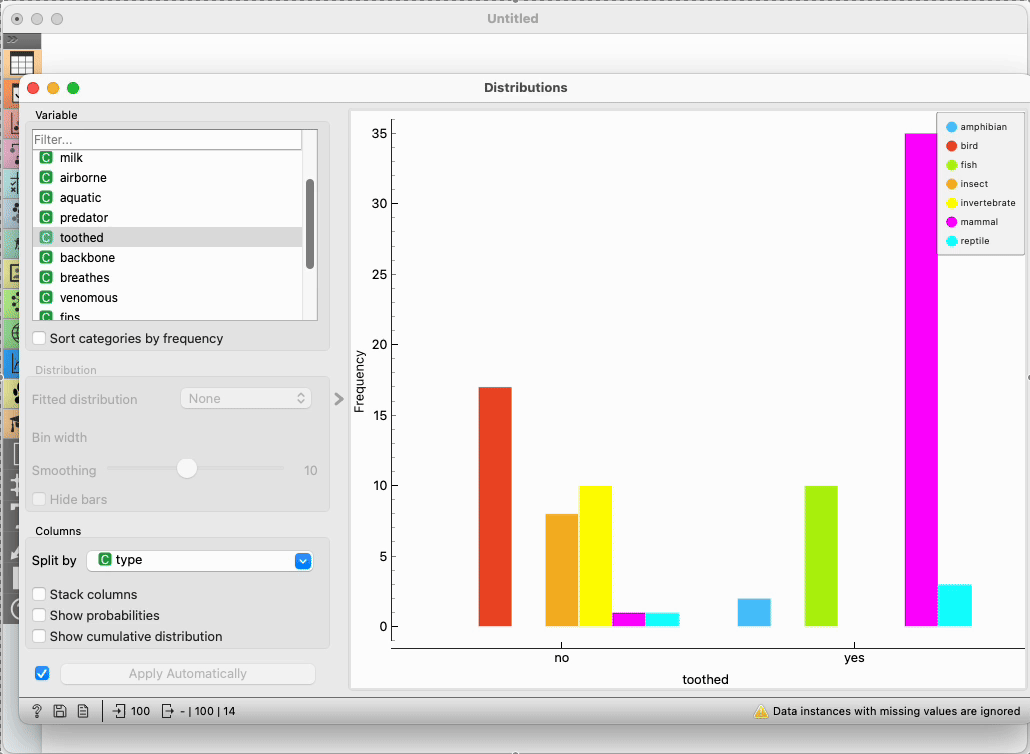
Again, we choose one of the features. Toothed, for instance, isn’t a bad option, as it separates fish, reptiles, and amphibians from birds, insects, and mollusks.
We go with a criterion proposed by the students and extend the tree on the board. In the previous step, the “gives milk” criterion already identified one group (mammals), and from there on, we were only splitting animals that don’t give milk. If we now choose toothed, for example, we won’t get a pure group on either side—both branches will need further splitting. That’s perfectly fine and no less effective.
… and Onward
We’ll now connect a third Distributions widget to the second one. In the second widget, we choose “No” (or “Yes”—or try one and then the other), and in the third, we search for the next feature to split the data.
If the students are independent enough, they can continue building the tree themselves: at each step, they find a variable that effectively separates the remaining animals (in the example above, those would be the non-mammals).
If they’re not ready to do this on their own, we continue building the tree together as a class. In practice, with one or two assistants in the classroom, this worked well even with sixth graders: they independently searched for and suggested the next split, and the teacher used one of their suggestions on their computer and drew it on the board.
Automatically Building the Model
After a few splits, we get tired: why should we keep clicking through distributions and searching for typical traits? The process seems straightforward enough—it doesn’t require much cleverness or creativity. The computer could go through all the features, calculate which one best splits the animals into groups, and use that. So why not let the computer do it?
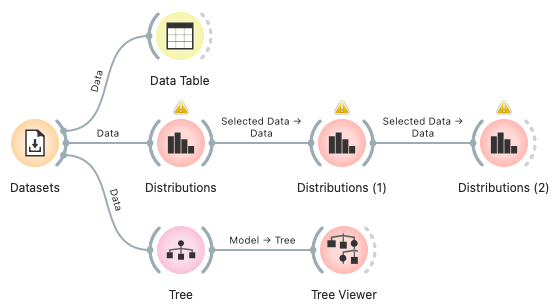
Connect the Datasets widget to the Tree widget. The Tree will automatically find the features that best split the animals into groups, using a process similar to the one we followed.
The Tree widget builds a tree. To view it, connect it to the Tree Viewer.
The tree might look like this:
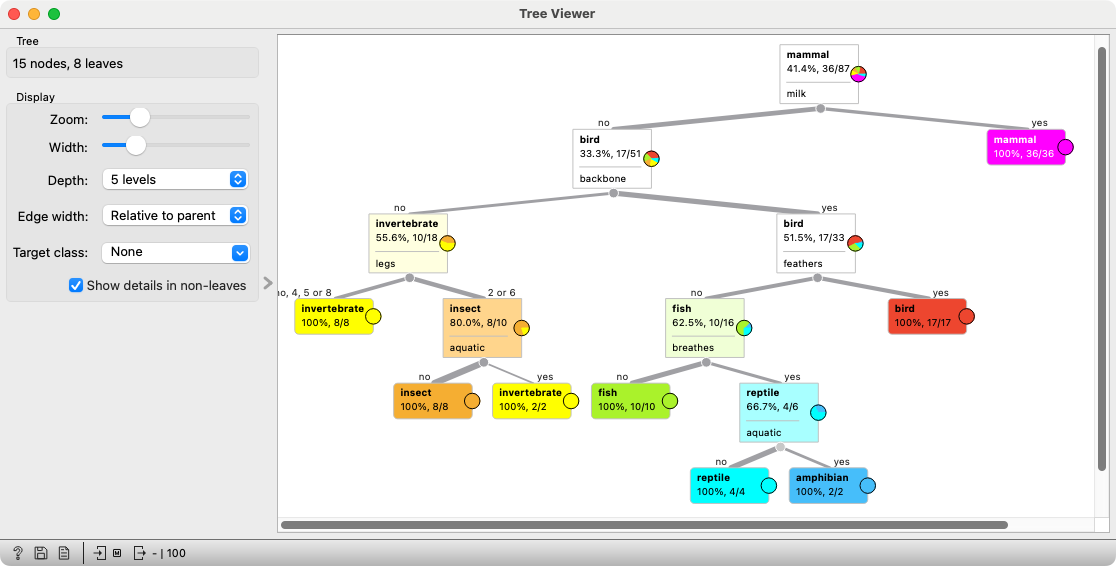
Review it together with the students and see whether it makes sense.
Make sure the students understand how it works: open the Data Table again, scroll to the bottom where the 13 unclassified animals are, and try to classify some of them using the tree.
Prediction
If the computer built the tree on its own, it can probably use it by itself too, right?
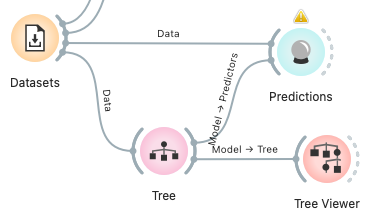
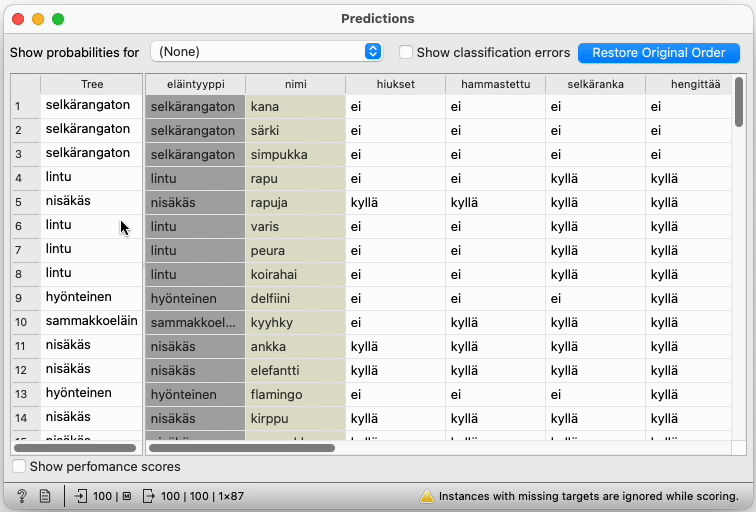
The Predictions widget requires two inputs: data about the animals and the model to use for predictions.
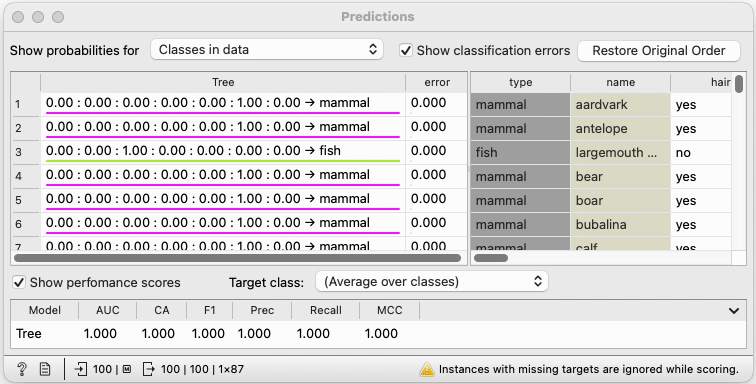
Configure the Predictions widget to hide probabilities and classification errors (these settings are at the top of the widget) to keep the display clean.
In the first column, we see the groups predicted by the model (i.e., the tree), and in the second column, the actual animal groups. For animals whose group is known, the predictions match. So, we can hope that the model correctly predicted the group for the animals at the bottom of the table. We scroll down and check.
(Note for teachers: The tree’s predictions for animals with known groups are, of course, accurate because the algorithm saw these examples while building the model—it could simply “memorize” them. If we wanted to properly test the model, we would need to temporarily hide part of the labeled data, build the tree using the rest, and then test it on the hidden examples. Students don’t need to worry about this, but a teacher should be aware of it.)
Back to Finnish
Now go back to the Datasets widget and once again select Animals in Finnish.
Take a look at the tree. Its structure might differ from the English version, since the algorithm may have randomly chosen a different feature somewhere. But if the computer successfully built a tree using English animal names and features, there’s no reason it shouldn’t manage the Finnish ones just as well.
In fact, we can check this: open the Predictions widget and see whether the tree correctly guesses the groups where they are known.
Scroll to the end of the table and discover that sopuli belongs to kalastaa.
At this point, the lesson may turn into a fun guessing game about Finnish words—at least, that’s what happened in our class.
Conclusion
We tell the students that computers build models from data in a similar way for completely different domains. For example, a model can be built to predict whether someone has a certain disease, which advertisement is worth showing to a visitor on a website, or whether there is an obstacle in front of a self-driving car.
The model we worked with took the form of a tree. Simple models like these were mostly explored in the early days of artificial intelligence. Today’s models are more complex, but the basic idea remains similar.
- Subject: science, biology
- Duration: 1 hour
- Age: 6th–9th grade
- AI topic: classification
- Materials
- Preparation for the lesson
- 🖨️ Print this page
- if we do not intend to carry out the activities entirely frontally, we will need a computer classroom; the computers must have Orange installed
- Further explanation
Placement in the curriculum
In terms of natural science: refresh differentiation between animal groups.
In terms of AI: students get to know a simple predictive model - a classification tree and learn how a computer can build it by itself. By doing this, they see how the computer “learns” from the data. They learn that this is only one representative among many. In terms of computer science in general: students describe an algorithm for building trees, so it is also about getting to know the concept of an algorithm.
Foreseen necessary widgets of Orange: Datasets, Data Table, Distributions, Tree, Tree Viewer, Predictions
Student:
- classify living things into groups according to common characteristics,
- defines species as the basic unit for classification and says that the main groups of living things are kingdoms,
- differentiates between invertebrates (snails, shells, insects, spiders, rotifers) and vertebrates (fish, amphibians, reptiles, birds and mammals),
- draw, read and explain a graphic display (e.g. histogram).