Zoo
Introduction
This activity can be used for rounding up the learning about animal groups (vertebrates, invertebrates, amphibians, reptiles, birds, fish etc.), as it gives students a thourough review of the characteristics of individual groups of animals as well as those of individual animals (Are dolphins fish? Do penguins have fur?).
The activity demonstrates the workings of a basic machine learning algorithm to help students grasp the practical principles underlying it. Given the enjoyable nature of the topic, the Zoo activity might even captivate their interest a little too much, if we leave them to their own devices.
We can also combine the activity with a trip to the zoo. If we decide to do this, we ask the students to write down the characteristics of a certain number of animals they see in the zoo. This will make their exploration of the zoo more systematic, and we can use the gathered data to build rules that describe animals from a particular group.
Alternatively, we can divide the students into groups, give each group some pictures of animals, and ask them to name the animals, identify their chatacteristics, and determine which animal group they belong to.
This activity is similar to Taxonomic keys for animal groups,since they both include a demonstration of the procedure for building a classification tree. The difference is that »Taxonomic keys« are intended for older students and involve exploring data with the help of visualisations. In the Zoo activity, however, the focus is on data collection, while the work with the computer is frontal.
Data preparation
If we connect the activity with a trip to the zoo, we give students forms to be filled out with data about a certain number of mammals, fish, insects and so on. We adapt the form to cover the kinds of animals that the students will actually be seeing at the zoo. It is recommended, however, that the form is designed in such a way that the students enter the same number of animals from each animal group, so that the data is properly balanced.
We can divide the students into groups or pairs. If each form contains three representatives of each group of animals, 8-10 groups of students should be enough, but having more won’t hurt.
In the next step, the students enter the collected data into an online form. This can be done either in school or at home.
If alternatively, we decide to just present the students with pictures of animals, the process will be similar, except they will fill in the data straight into the online questionnaire.
Distinguishing Animals Based on One Trait
We download the file animals.xlsx and open it in Excel. The file contains a header lines for the table that we will create together with students and read into Orange. The first line contains names of columns; we will add them as we go. The next two lines (which are hidden) instruct Orange that the first column contains text values (animal names), and the third line marks one column as »class«, that is, the value that the model is trying to predict. We do not need to explain this to students.
We ask the students to suggest two animals that belong to different animal groups. Let’s say they choose a frog as an example of an amphibian, and a tiger as a representative of mammals. We fill in the names and species of these animals into the table. We then ask the students to tell us which traits we are going to use to distinguish them by. For the sake of the next steps of the activity, it is recommended they choose some meaningful trait rather than, for example, colour. Let’s say we have decided to distinguish the animals based on whether they are slimy or not; in that case, we add the column »Slimy« to the table, and for the frog, we put in a »yes«, while for the tiger, we enter »no.«
We then read the data together and display it in Orange.

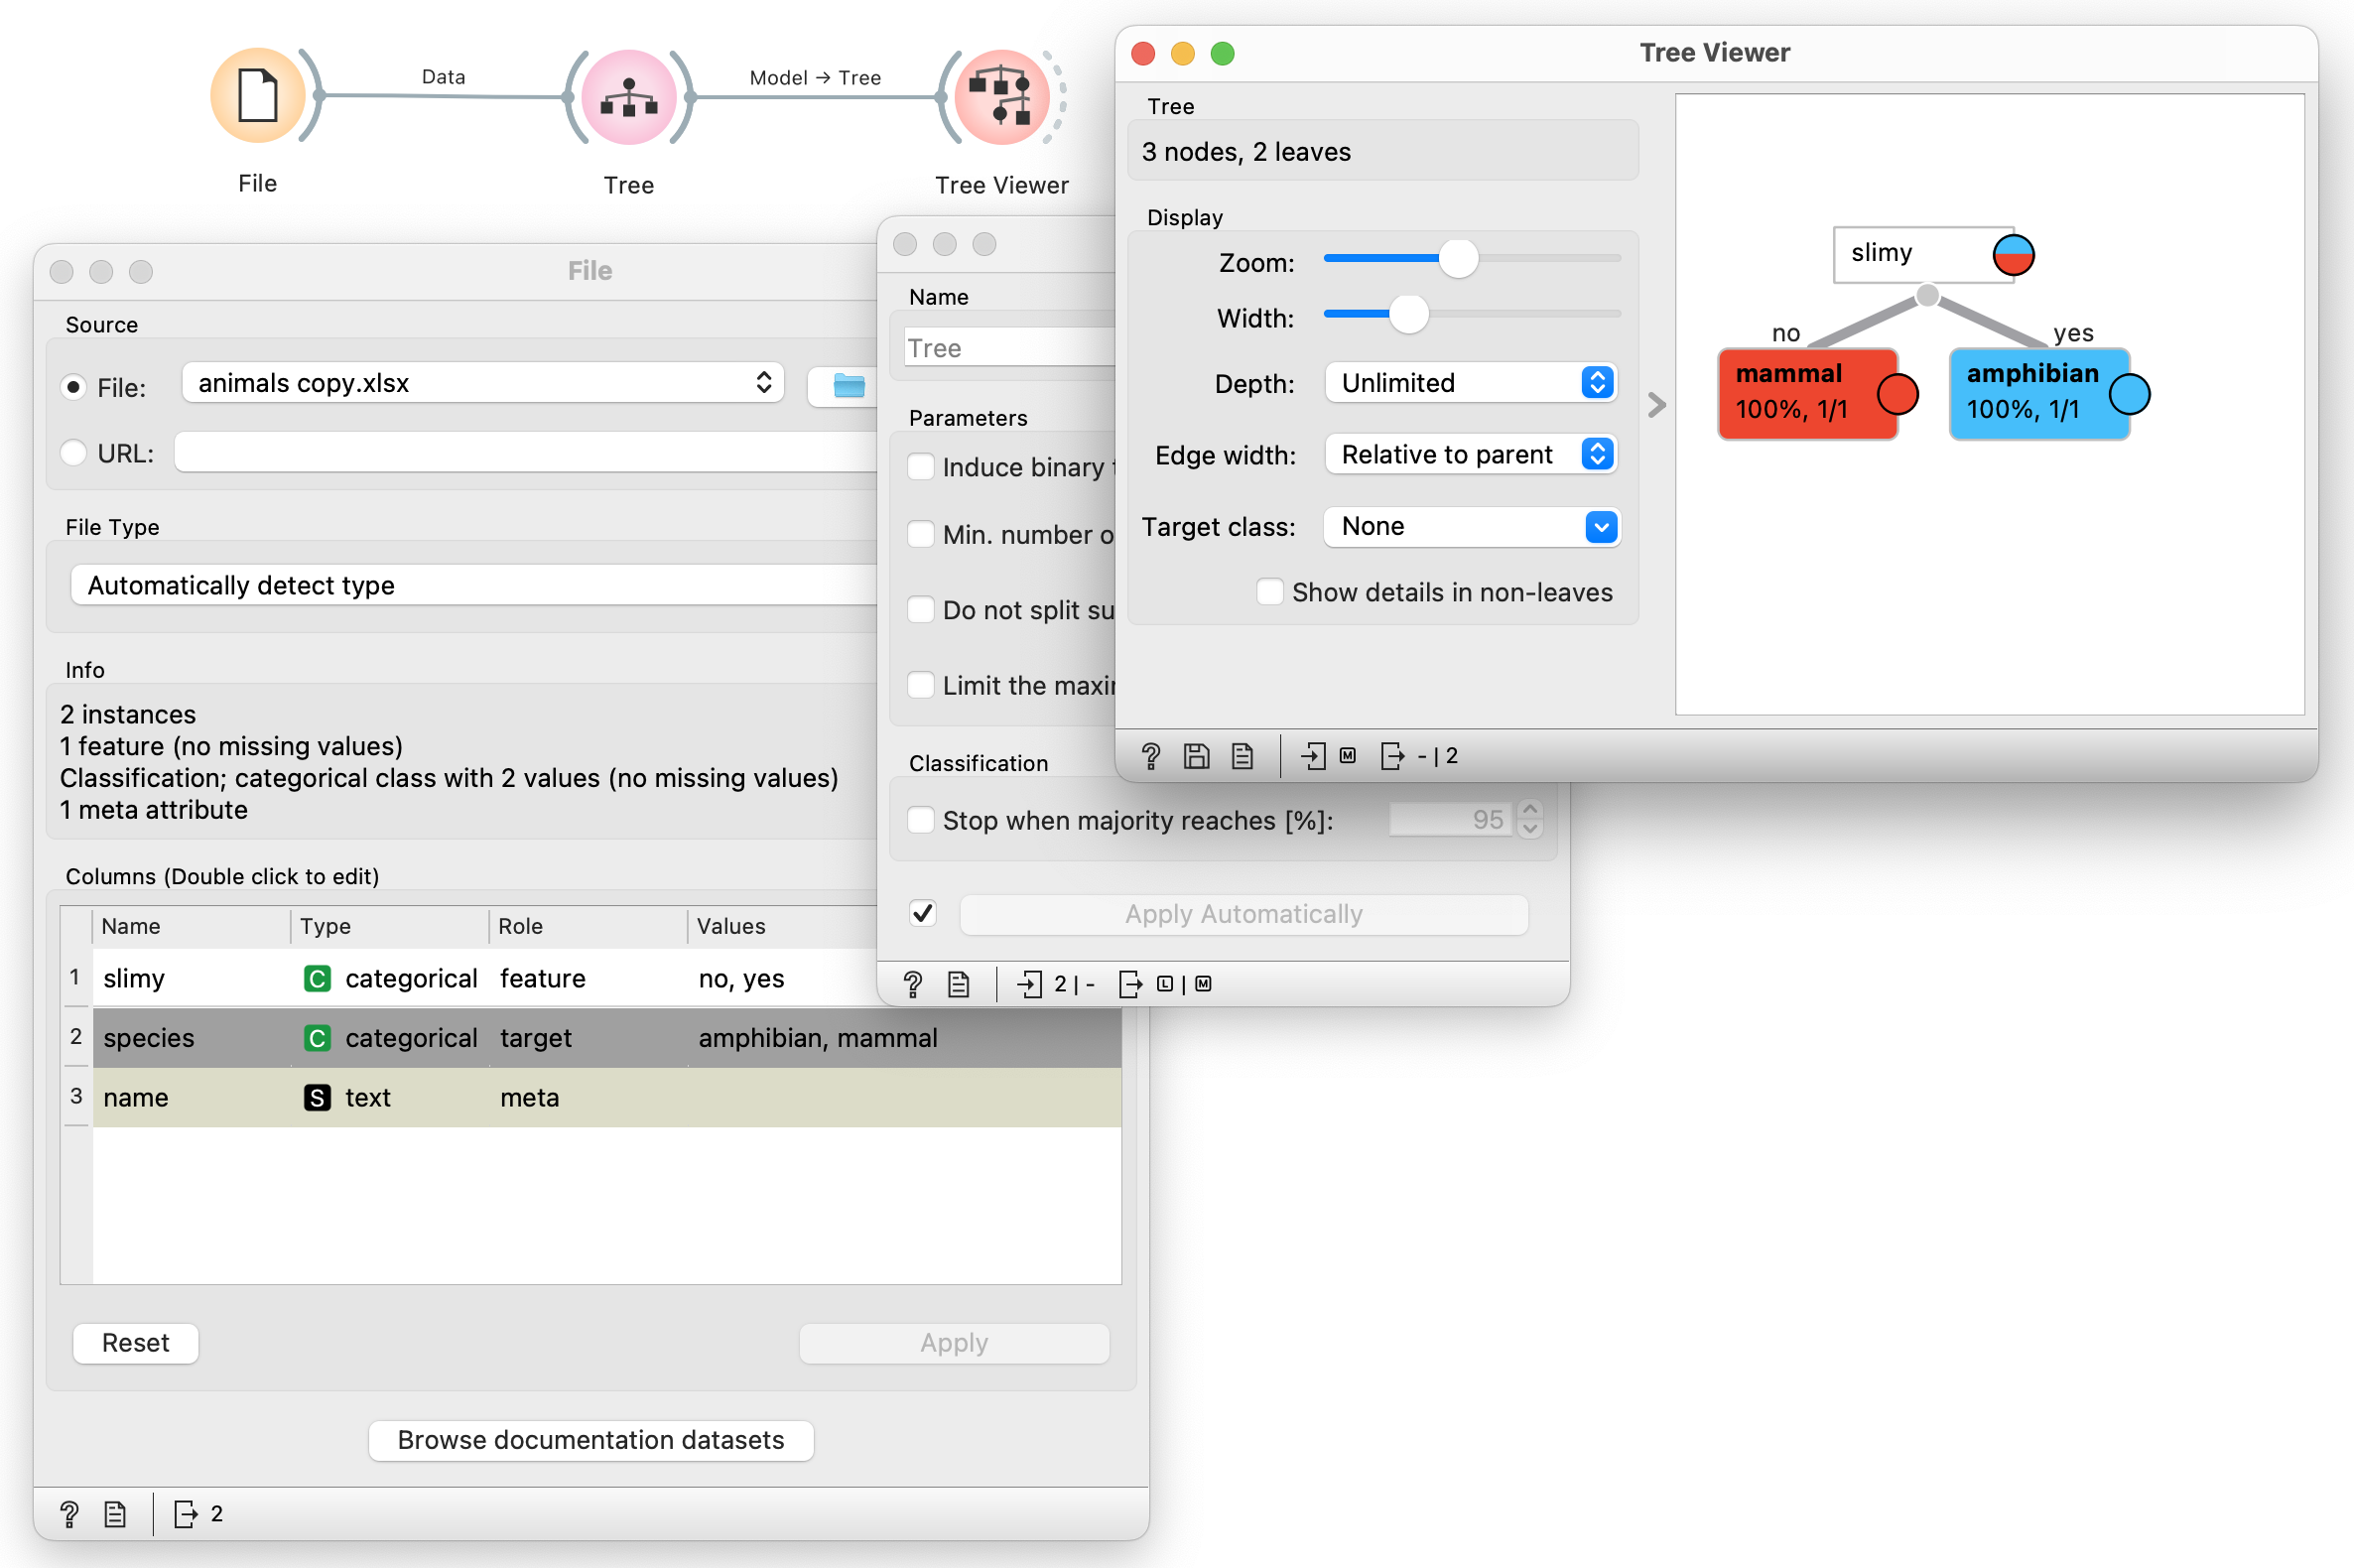
- In the File widget, we select the file that we have created in Excel.
- In the Tree widget, we exclude all the parametres related to cutting.
- In the Tree Viewer widget, we see the resulting tree.
We read the tree together with the students: our tree says that it is necessary to check if an animal is slimy. If »yes«, it is an amphibian. If »no«, it is a mammal.
We continue by asking the students to propose two more animals from the same two groups (in our case, another mollusc and a mammal; if we work with other groups of animals, then they should simply add two more from those groups). Let’s say they have proposed an elephant and a salamander. We enter these animal names in the first column, and the data about their sliminess into the third column (»no« for the elephant and »yes« for the salamander). We leave the Species column empty.
We save the data in Excel, and in the File widget, we click on Reload to load the new data.
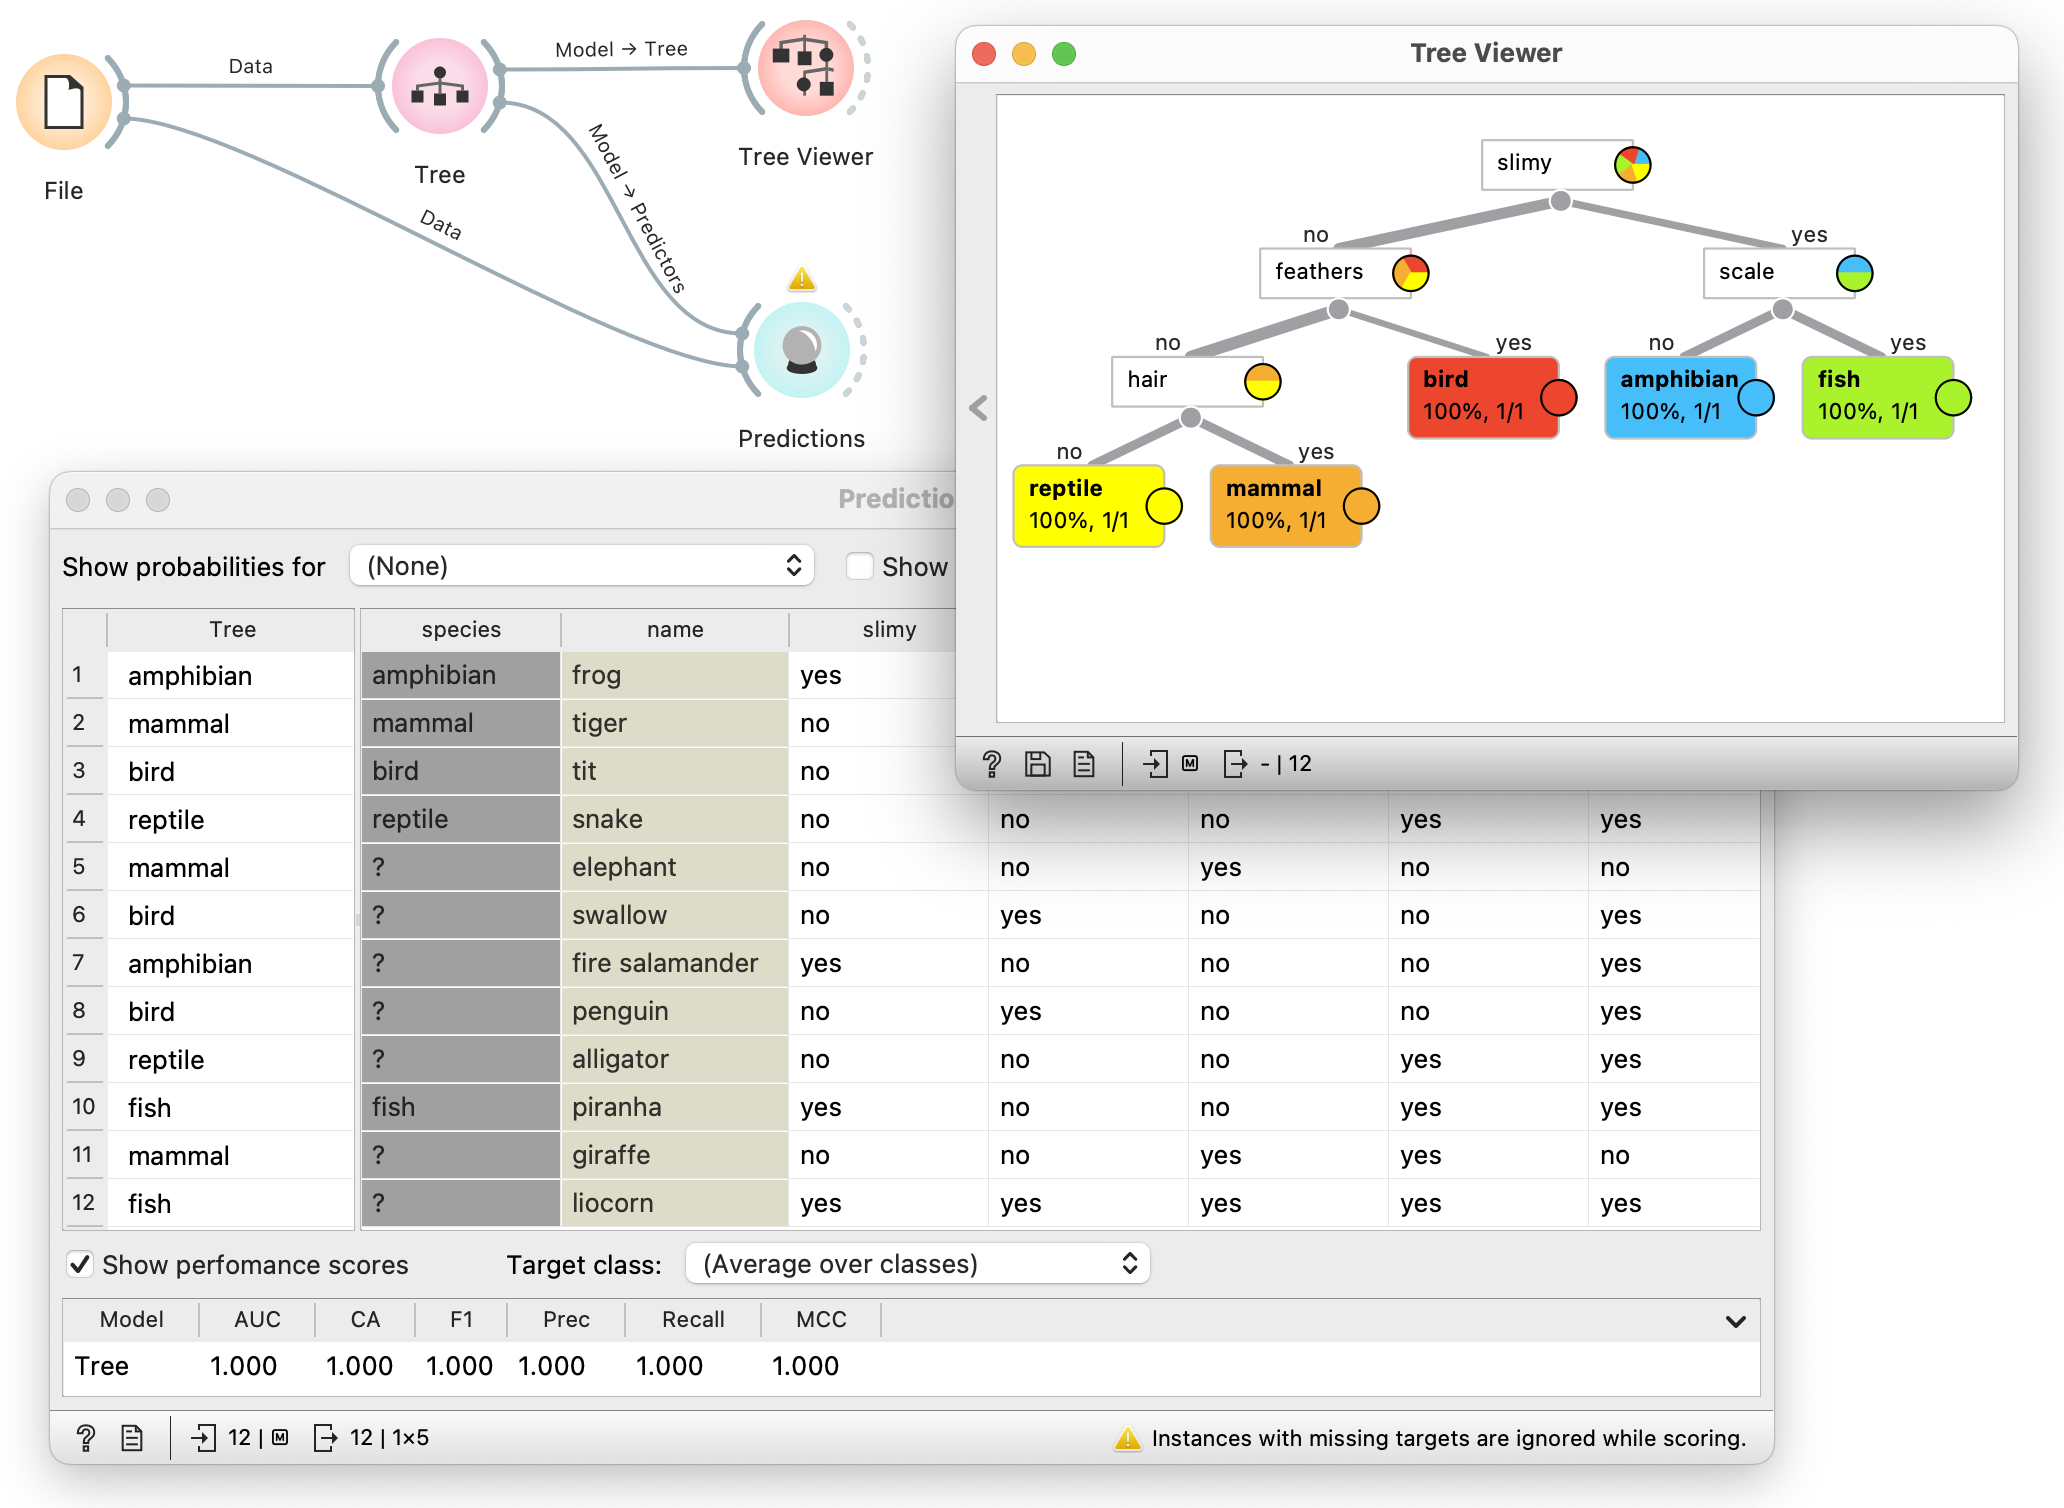
We add the Prediction widget to the Orange workflow and set it as shown in the picture (We set the Show Probabilities For to (None) and disable Show Classification Errors to remove redundant columns.
In the left part, we see the predictions made by the tree: in the case of the elephant, the computer has discovered that it is a mammal, while it classified the salamander as an amphibian.

We now need an animal that does not belong to either of these two groups. When we previously asked the students to come up with more animals, they probably suggested a bunch of different animals (each student their favourite animal or the one they find the most interesting); we can choose from some of those, as long as they belong to neither of the two groups. Sometimes the students ask themselves on their own what would happen, if we added to the table an animal that belongs to a totally different group. If they don’t, we try to nudge them in that direction.
Let’s say they want to see the computer’s prediction for a swallow. The students will probably figure out on their own that the computer cannot classify it under birds, since it only knows mammals and amphibians. In which of these two groups will it then place the swallow? If the tree is still being projected, they will most likely find out on their own that the computer has placed the swallow under mammals, since it isn’t slimy.
We fill in the data about the swallow (its name and the information that it is not slimy) in the table, and use the Predictions widget to make sure it has really ended up among mammals. (Don’t forget: save in Excel and reload in the File widget).
Building a Tree: Adding Another Criterion
So how do we teach the computer to distinguish between birds, amphibians, and mammals? Obviously, by providing it with an example of a bird. Let’s say the students suggest a tit; we add the tit to the table: its name, the animals group it belongs to (bird), and the information that it isn’t slimy. But this will clearly not be enough (save in Excel and reload): we can see that in the tree, »non-slimy« animals now include both birds and mammals, since we don’t have enough data to distinguish between them.
We therefore add another column to the table. To this column, the students can, on their own, add a suitable trait. Quick tip: let’s avoid data on the number of legs, as it can have too many different values, which will distort and complicate the tree. It is preferred to have data for which the values can only be a »yes« or a »no«.
For instance, the students can propose documenting whether the animal has feathers or not. In that case, we introduce a new column Feathers, and fill it in for each animal, indicating whether the animal is feathered or not.

We save the data in Excel, reload in the File widget, and this is what we get:

It is important to make sure that the students understand what the emerging classification tree means: slimy animals are amphibians, while for the rest, it is necessary to determine whether they have feathers ot not. If they do, they are birds, otherwise they are mammals.
Building the Tree Further
By now, the students will understand what is happening and how to keep the game going. We keep adding new animals, for example fish, and suitable variables that describe them (Does it have scales? Or: breathes with gills.).
This activity can turn out very interesting and we need to be prepared for different scenarios. The students might, for instance, suggest considering whether an animal has fins. This becomes interesting if we add dolphins to the table. Talking about dolphins, we can take this opportunity to revise that they are mammals; when we add mammals with fins, fins are suddenly also no longer a good criterion for identifying fish (and in fact, they really aren’t).
Or the students could add penguins to the table and start arguing whether they are fish (rather than: birds) or whether they have fur (not: feathers).
They might also add more data than necessary, or they might add data that won’t tell us anything that couldn’t already have been deduced from existing features. In the picture below, there is data about whether an animal lays eggs.

The students might become curious about what would happen if the answers in the table were either all »yes« or all »no«. They will already be able to answer this kind of questions on their own, with the help of the tree. Nevertheless, it is still valuable to also demonstrate this scenario with an example. We have decided to name a slimy animal with feathers, fur, and scales that also lays eggs a lyocorn, and have found out (first manually with the help of the tree, and then also by using the Predictions widget) that the lyocorn is, apparently, a type of fish.

Classification tree from the collected data
In the next step, we load the data about animals that the students have entered into the questionnaire, into Orange and display it. However, since tha data could contain too many errors, it makes more sense to start by using the correct data that we have prepared beforehand.
The tree constructed from the correct data and the tree that we have constructed above will only differ in the animals it contains and in the features that desribe them. Together with students we can make sure that the tree accurately describes the characteristics of individual groups of animals.
We then show the students the tree constructed from their data. You can see an example in the picture below. The more errors the tree contains, the bigger it will be. Let’s take this chance to ask why this is so.

The poor computer is clearly trying to learn from misleading data. As an example, we can imagine a confused teacher who on Monday claimed that 5 times 6 equals 36, while on Wednesday, he said it was 30. If students believe him, they will think that this product depends on the day of the week. Such multiplcation table would clearly be more complicated (not to mention wrong). The computer suffers similar woes when it is learning from the misleading data about animals.
In the Tree widget, we turn on the prunning parameters and set them in such a way that we get a tree of a suitably small size. As the concrete numbers will depend on the number and accuracy of the data, we pay attention to what is happening to the tree as we modify the parameters. Typically, it will suffice to set a minimum number of instances in the leaves, or the next parameter that tells us how many more training cases/examples to split into further subcategories. We can test the concrete suitable settings as we prepare for the school lesson. We also need to make sure that the tree is still useful.
In the picture below, we have required at least five instances/examples in a leaf, and decided to not divide the subsets containing less than 20 cases. We can explain to the students that by doing so, we have told the computer to disregard the details, as they could very well be wrong.

Each leaf of the tree contains a decision, and below it a percentage that tell us the proportion of animals in that leaf actually belong to that very group. For example, there is a leaf that contains 17 animals, all of which are insects. In the adjacent leaf, 83% of animals are insects, and they are joined by another group. We can tell which group that is from the colour; in the pie chart, we can see a drop of yellow, so we search in the tree for a yellow leaf, and find out that it is birds. Alternatively, we move the mouse to the leaf in question and hover over it. A box should appear that shows the distribution of animals by group.
Splitting Hairs
What is going on in this leaf? And, for that matter, why do we have insects appearing in two leafs instead of just one? (This is of course just an example for this specific data. There will be other interesting things happening with the data that the students will compile, and that we will analyse. We can prepare for this, at least to some extent, beforehand at home, while the rest of the analysis will be directed by the students.)
The answer to the second question is obvious: the leaves differ based on the criterion of whether an animal has bones. The group of insects on the right contains insects with bones. Which could these be?
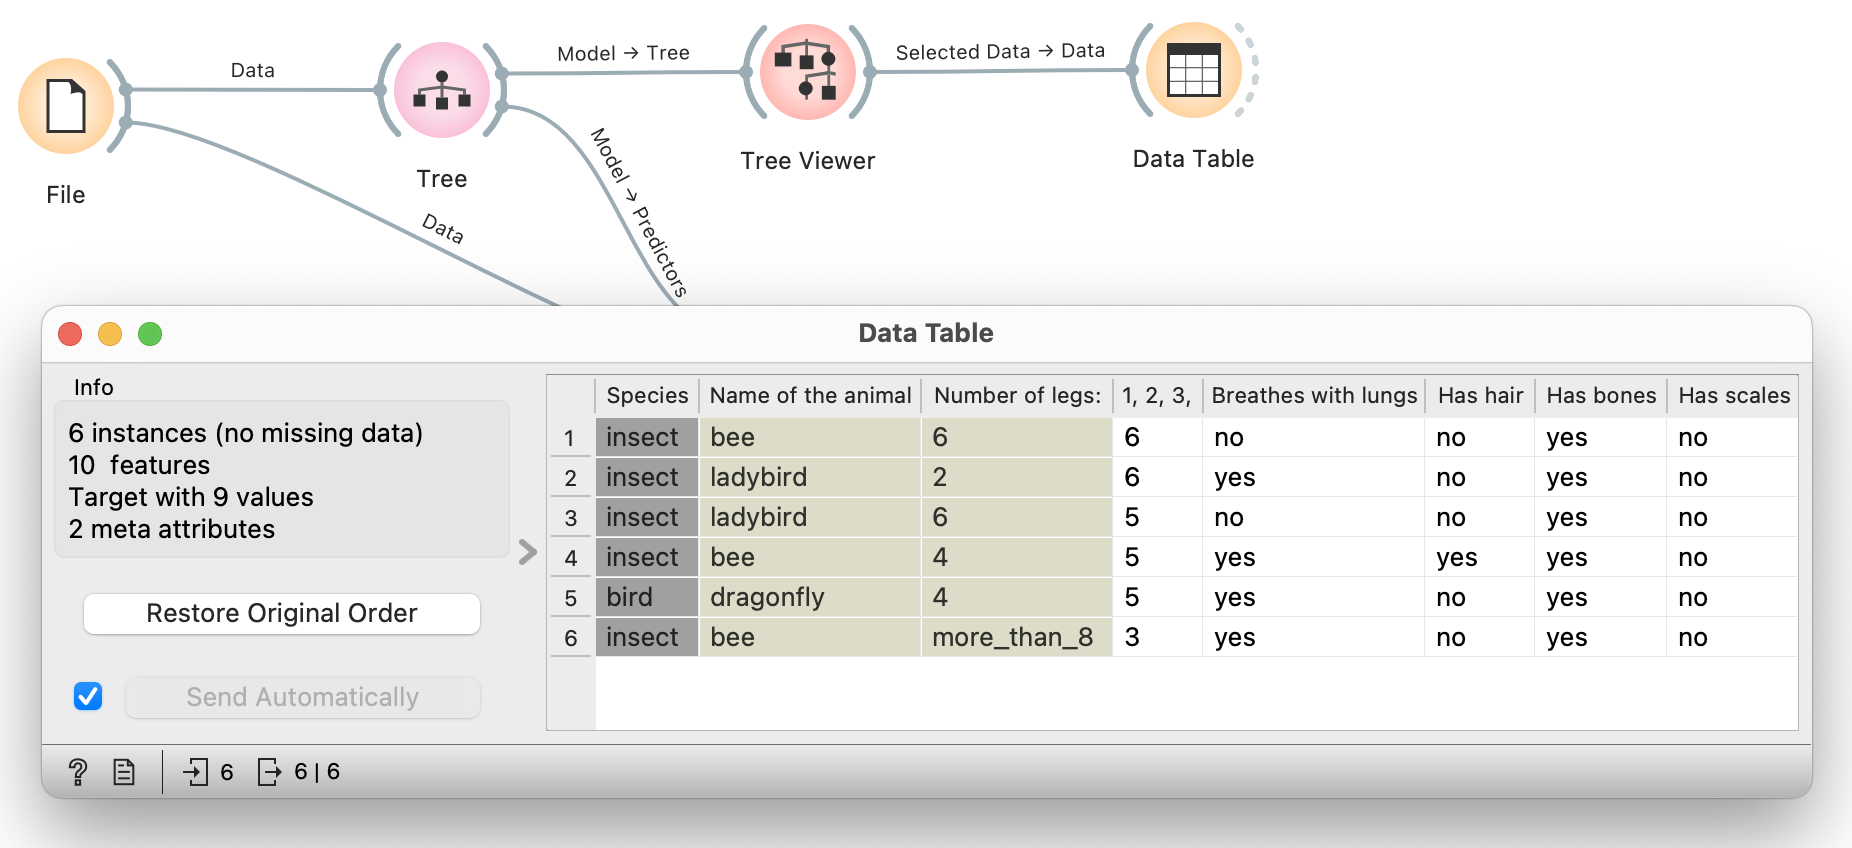
We connect the Tree Viewer widget to the Table. In the Tree Viewer widget, we select the leaf that we want to analyse. The Table displays the animals that have found themseleves in that leaf as the tree was being constructed.

We can see that insects with bones are bees and ladybugs. Supposedly.
At the same time, the table also gives us the answer to the second question: the »bird« that has found itself among the insects, is a dragonfly. This is clearly a case of an incorrectly assigned group. But another type of error would also be possible: for example, a particular bird could be described as having no feathers, or having six legs, or something of that sort. In that case too, that bird would find itself in the company of insects.
Let’s now see why prunning is necessary: if we were to build the tree »all the way to the end«, the computer would look for the features in which the »bird« dragonfly differs from the »bony« insects ladybugs and bees. From what we can see in the table, the dragonfly is only different in that it, unlike insects, lays eggs. Therefore, if we didn’t simplify the tree, the next question would be whether the bird in question lays eggs. (This again gives us an opportunity to discuss how insects reproduce, if they don’t lay eggs. Could they perhaps be viviparous?).
Other interesting leaves can be analysed in a similar way.
Summary
To wrap up, we tell the students that similar to what we did in this activity to learn about groups of animals, we could also collect data about the ingredients of different dishes and use it to predict whether a particular student will like a certain dish or not. Or data about symptoms to try to diagnose diseases. Not only would it be possible, this is in fact being done.
- Subject: natural Sciences and Technology
- Duration: 1 hour
- Age: Grade 4
- AI topic: classification
- Materials
- Preparation for the lesson
- Prepare and print out the forms before visiting the zoo
- Prepare the questionnaire for data input
- The teacher will need a projector and a computer with Orange Data Mining installed
- Further explanation
Placement in the curriculum
In terms of natural sciences and technology: refresh differentiation between animal groups.
In terms of AI: učenci spoznajo preprost napovedni model – klasifikacijsko drevo in izvedo, kako ga lahko računalnik sam zgradi. S tem vidijo, kako se računalnik “uči” iz podatkov. Izvedo, da je to le en predstavnik izmed mnogih. Z vidika računalništva na splošno: učenci opišejo algoritem za gradnjo dreves, torej gre tudi za spoznavanje koncepta algoritma.
Foreseen necessary widgets of Orange: File, Tree, Tree Viewer, Predictions, Data Table
Student:
- group living things according to common characteristics,
- identify the species as the basic unit of classification and state that the main groups of living things are kingdoms,
- distinguish between invertebrates (snails, clams, insects, spiders, roundworms) and vertebrates (fish, amphibians, reptiles, birds and mammals),
- draw, read and interpret a graphical representation (e.g. histogram).