Reservations
Introduction
We often despair of “terribly” designed timetables that are totally inappropriate for us. Who has managed to make such a timetable? But it turns out that it is not an easy task at all. We will be dealing with the much easier task of a timetable clerk who has only one classroom and several requests to book a classroom at different times. In fact, the requests are such that he cannot accommodate them all because of time conflicts between them. So there will be a few requesters who will be disappointed in any case, and the scheduler tries to keep these to a minimum. What is the maximum number of reservations he can accommodate?
Observing the data
We are given a list of reservations (reservations.csv), where each reservation is described with a start and end time. For simplicity, these times are in minutes from the start of the day. A quick look at the data shows the following.

We are dealing with 500 reservations. But how special is this data? Perhaps all the reservations start early in the morning and stretch almost the whole day. This would make it easier for us to deal with, but we can see from looking at the data earlier that this is not the case. Let’s look at the distribution of the start times of the reservations. Here we are interested in which period contains more and which contains fewer reservation starts.
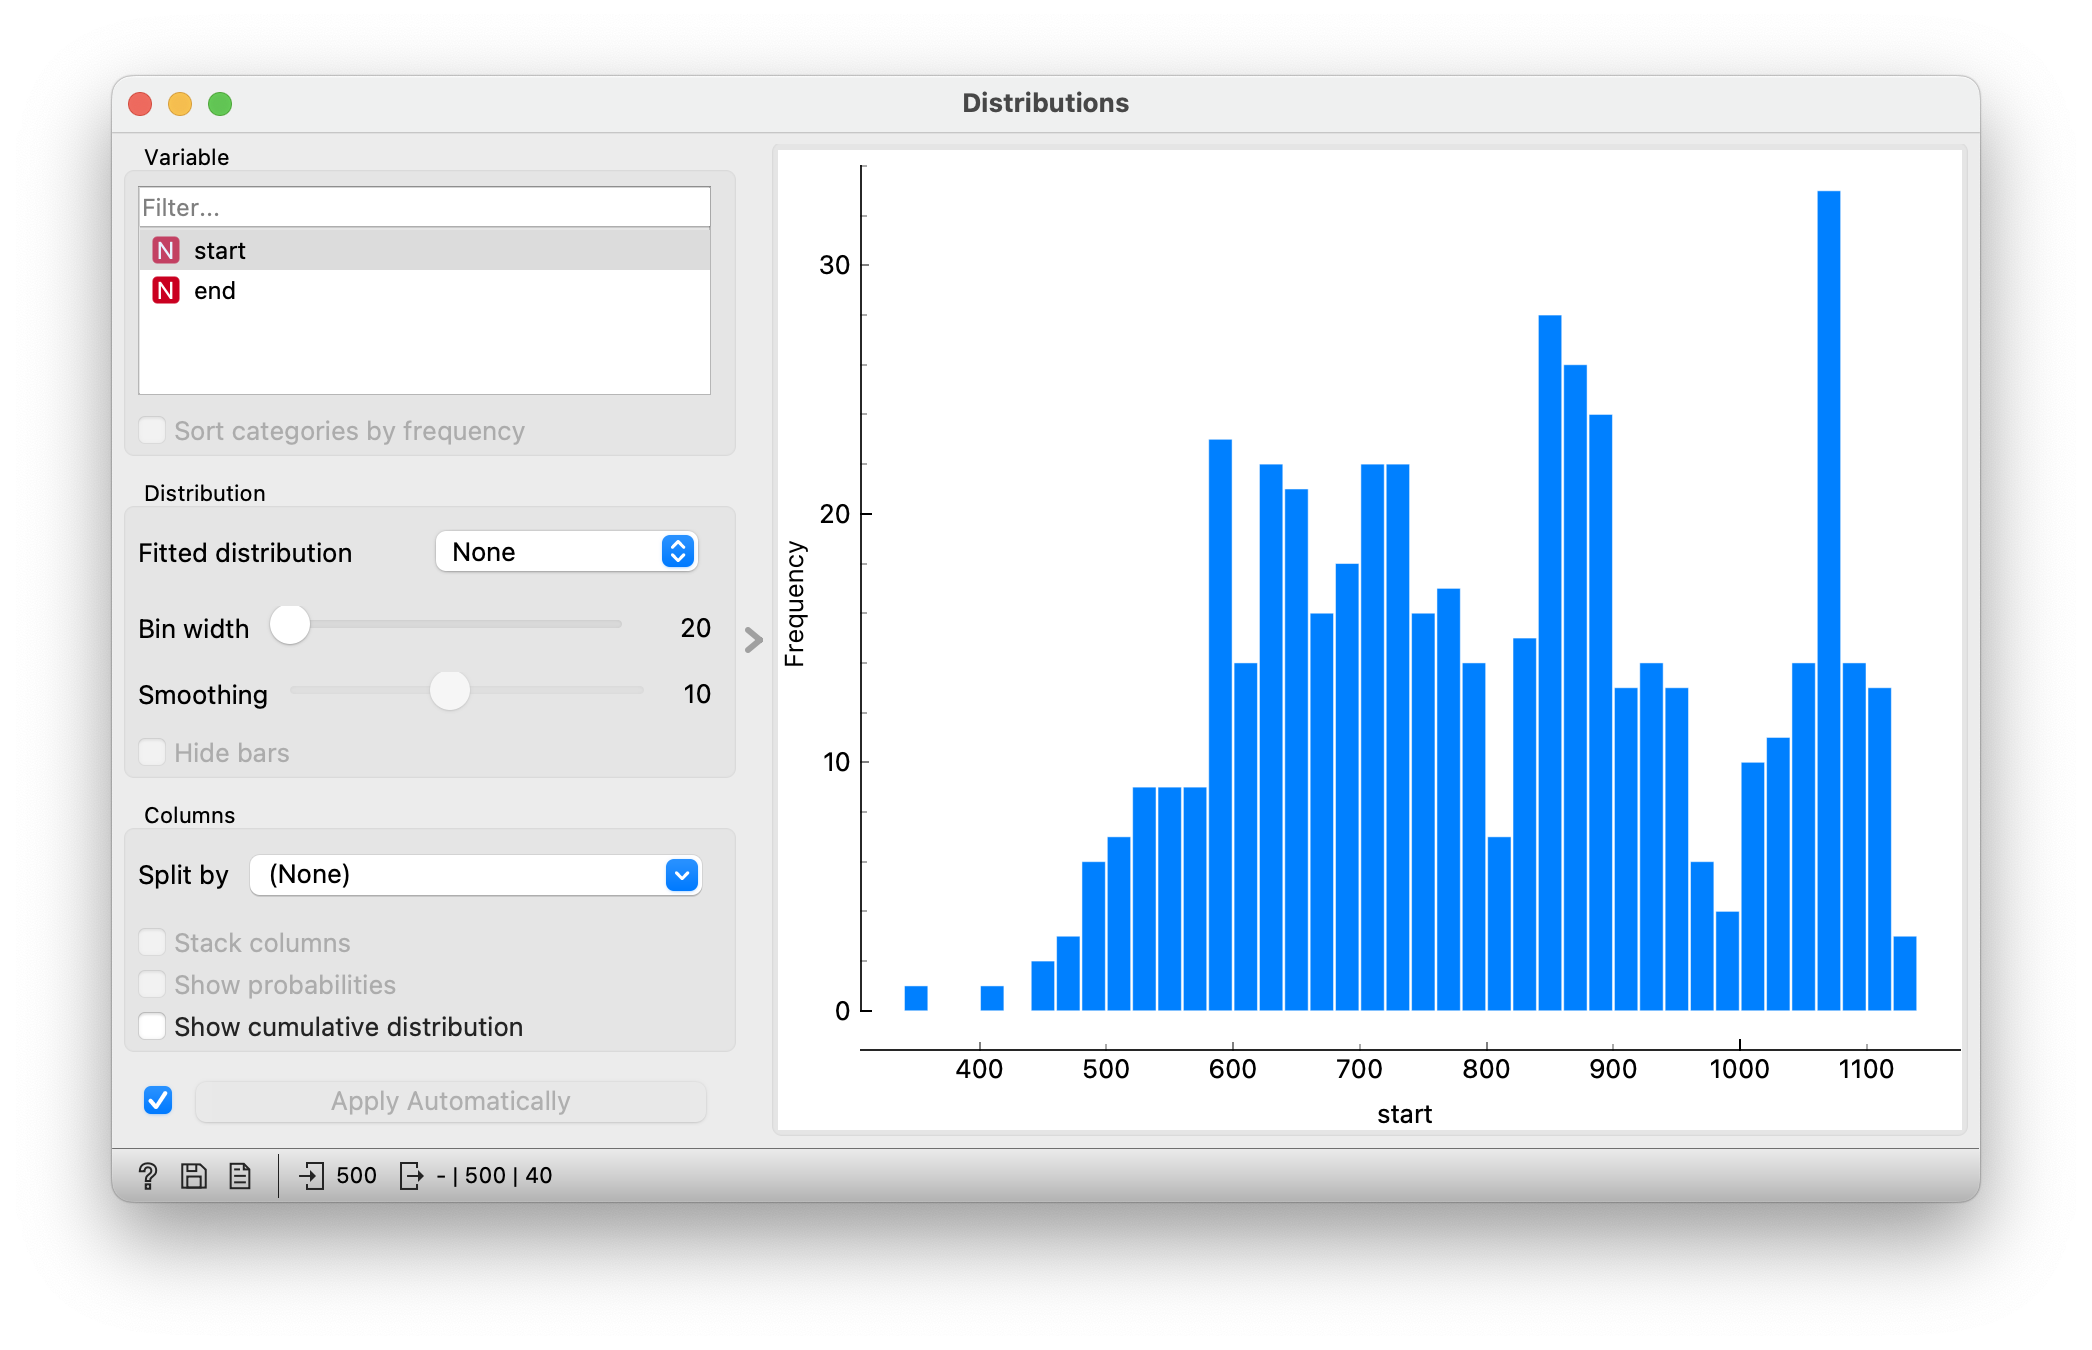
However, we can already see some characteristics of this distribution. There are three distinct groups of provisioning origins. The first group is somewhere between 500 and 800, the second group around 900 and the last around the 1100th minute. If we convert this into hours, the first group is in the morning and represents the period between 8am and 1pm. Lunch is probably next. The second group is the afternoon group starting around 3 pm and the last group is the evening group starting around 6 pm. If we look at the distribution of the ends, we come to a similar conclusion.
Construction of a new attribute
What about reservation lengths? Are the start and end of a reservation completely independent or are they somehow linked? In the data preview, we can quickly see that the start and the end are quite similar. Clearly, these are (at least mostly) fairly short reservations.
Often not all relevant attributes are included in the data. We can use a method that will try to discover such an attribute on its own. Better still, we can use our knowledge of classroom reservations and add an attribute representing the length of the reservation ourselves, as it may come in handy later in the problem solving.

Let’s take a quick look at the distribution of reservation lengths. Lengths are not evenly distributed either. Most reservations are short, lasting around 5 minutes, while others are longer, requiring somewhere between 10 and 30 minutes. Given the amount of small reservations, it will probably be possible to fit a large number of reservations on the timetable.

Modelling the problem
From a set of reservations, we want to build a schedule, which is a sequence of reservations in which each reservation starts at a time greater than or equal to the end of the previous reservation in the sequence.
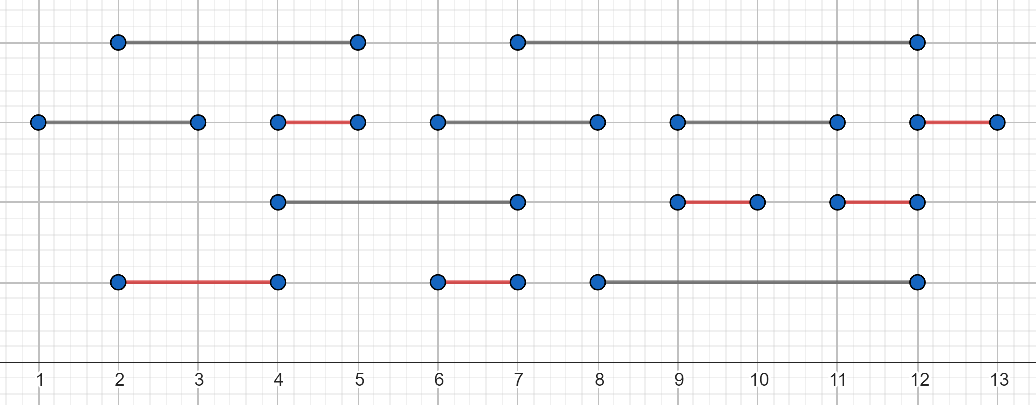
Problems are better understood and solved if we can visualise them properly. Reservations can be represented as lines on a number axis representing the time of day. In the figure below, the y-coordinate of the lines does not play a role (they are drawn at different heights to make the figure transparent), while the x-coordinates of the lines correspond to the start and end of the reservations. The red distances represent one possible sequence corresponding to the timetable. Actually, in this case it is not possible to select more than 6 distances, so this is one of the optimal solutions.
Reservations can also be visualised in a different way, as points in a plane. Here, the x-coordinate should correspond to the start of the reservation and the y-coordinate to the end. All points will therefore be located above the symmetry of the first quadrant. They can be represented by a scatter plot. What does the timetable look like in this interpretation? If we start the timetable at time 0, we move upwards from the coordinate (0,0) for a while until we reach the height at which a point is located. Now move right through the selected point to the symmetry and repeat the process. This is how we build a kind of staircase, and the aim is to build one with as many steps as possible.

In the following, we will focus on the first visualisation with distances.
Algorithms
A large number of reservations have been made, so we need a systematic process or algorithm to find the best possible timetable. Let’s look at three sensible ideas and present some examples of Python implementations. We will assume that the reservations are given in the form of a list data, where the individual reservations are represented as a dictionary with the keys start and end.
data = [{'start': 1073.9, 'end': 1079.5}, {'start': 604.7, 'end': 620.6}, {'start': 723.6, 'end': 743.0} ... ]
Let’s not waste time waiting for the next reservation, so let’s schedule the reservation with the earliest start time. Remove the reservations that conflict with the selected one and repeat the process. The solution below first arranges the reservations by their start time and maintains the end time of the last activity in the schedule (
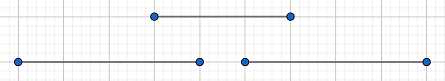
time) and the number of reservations in the schedule (num). Instead of deleting reservations, it simply skips them.data.sort(key=lambda item: item['start']) time, num = 0, 0 for item in data: if item['start'] >= time: num += 1 time = item['end'] print(num)By using the earliest start reservation strategy, we can build a schedule with 58 reservations. However, we can quickly think of a case where this strategy fails. If the earliest reservation is also a very long reservation, it may not be the best choice, as illustrated by the example below.

It might make more sense to choose short activities first to avoid the previous problem and to minimise conflicts. Arrange the reservations in order of length from shorter to longer and deal with them in that order. For each reservation, we check whether it can be added to the timetable (
used). For this purpose, we need to check that it does not interfere with any of the activities in the timetable. If it does not, add it, otherwise skip it.data.sort(key=lambda item: item['end']-item['start']) used = [] for item in data: conflict = False for other in used: if max(item['start'], other['start']) < min(item['end'], other['end']): conflict = True if not conflict: used.append(item) print(len(used))The strategy of selecting the shortest activities can result in as many as 88 reservations being placed on the timetable. This is a significant improvement, but still not optimal. Can you think of an example where this strategy fails? Even a short reservation can intersect with several others, so longer reservations may be a better choice.
Choose the reservation with the earliest ending, which is the least restrictive in choosing subsequent reservations because it ends early. The only difference compared to the first solution is the order in which the reservations are processed. This time, the ones with the earliest end are first in line.
data.sort(key=lambda item: item['end'])
time, num = 0, 0
for item in data:
    if item['start'] >= time:
        num += 1
        time = item['end']
print(num)
This process produces a timetable with 91 reservations, which is also the optimal solution. We can prove that the procedure does indeed find the optimal solution by a contradiction. Suppose that our timetable (illustrated in the first row in the figure below) is not optimal, so it only agrees with the optimal one (second row) in the first few reservations (in black), and then the two timetables diverge. In the optimal schedule, we can replace this first different reservation with our proposal, which does not spoil the rest of the optimal schedule, as it finishes the earliest (due to the way the reservation is chosen in our algorithm). So there is an optimal schedule (third row) that agrees with ours, and the assumption of the existence of a different optimal schedule was wrong.

Conclusion
Data visualisation is an important step in solving any problem. It allows us to better understand the problem, to discover any peculiarities in the data and to better design algorithms to solve the problem.
We have looked at three examples of greedy algorithms. Greedy algorithms are algorithms that always choose the move that looks the most promising at a given time when building a solution. This does not mean that this will ultimately lead to the optimal solution. Two greedy strategies were not optimal, but the third was. The two sub-optimal solutions were also quite successful.
This is a well-known problem in computer science called activity selection. In the related field of scheduling, there are a whole bunch of similar interesting challenges.
- Subject: informatics
- Age: 1st year
- AI topic: algoritmi
- Materials
- Preparation for the lesson
- computers with Orange installed
Placement in the curriculum
In terms of informatics: Pri reševanju problema si dijaki pomagajo z različnimi načini modeliranja. Osnujejo algoritem za rešitev zastavljenega problema in ga implementirajo v izbranem programskem jeziku. Kritično ovrednotijo različne požrešne algoritme in razmišljajo o njihovi optimalnosti oz. protiprimerih.
In terms of AI: Dijaki uporabljajo vizualizacije za odkrivanje zakonitosti v podatkih. Spoznajo tudi pomembnost vključevanja domenskega znanja in konstrukcije novih atributov.
Foreseen necessary widgets of Orange: File, Data Table, Distributions, Feature Constructor, Scatter Plot
Activity is aligned with the teaching objectives of the subject:
- During the activity, the student develops the basic competence of modelling problems in science and technology,
- the activity encourages the student to think critically about the solution to the problem,
- the activity trains the student to develop algorithms in a programming language.