Similarity between dialect groups
The activity is interesting for Slovenian students because it deals with Slovenian dialects. However, it can also be modified for other countries (their dialects or dialect groups).
Introduction
We upload a corpus of Slovenian dialects in which different speakers describe old houses in their environment. Ask students how to identify dialect groups, how they are similar or different. How would they draw up features to make the most successful comparison of dialects?
Observing the data
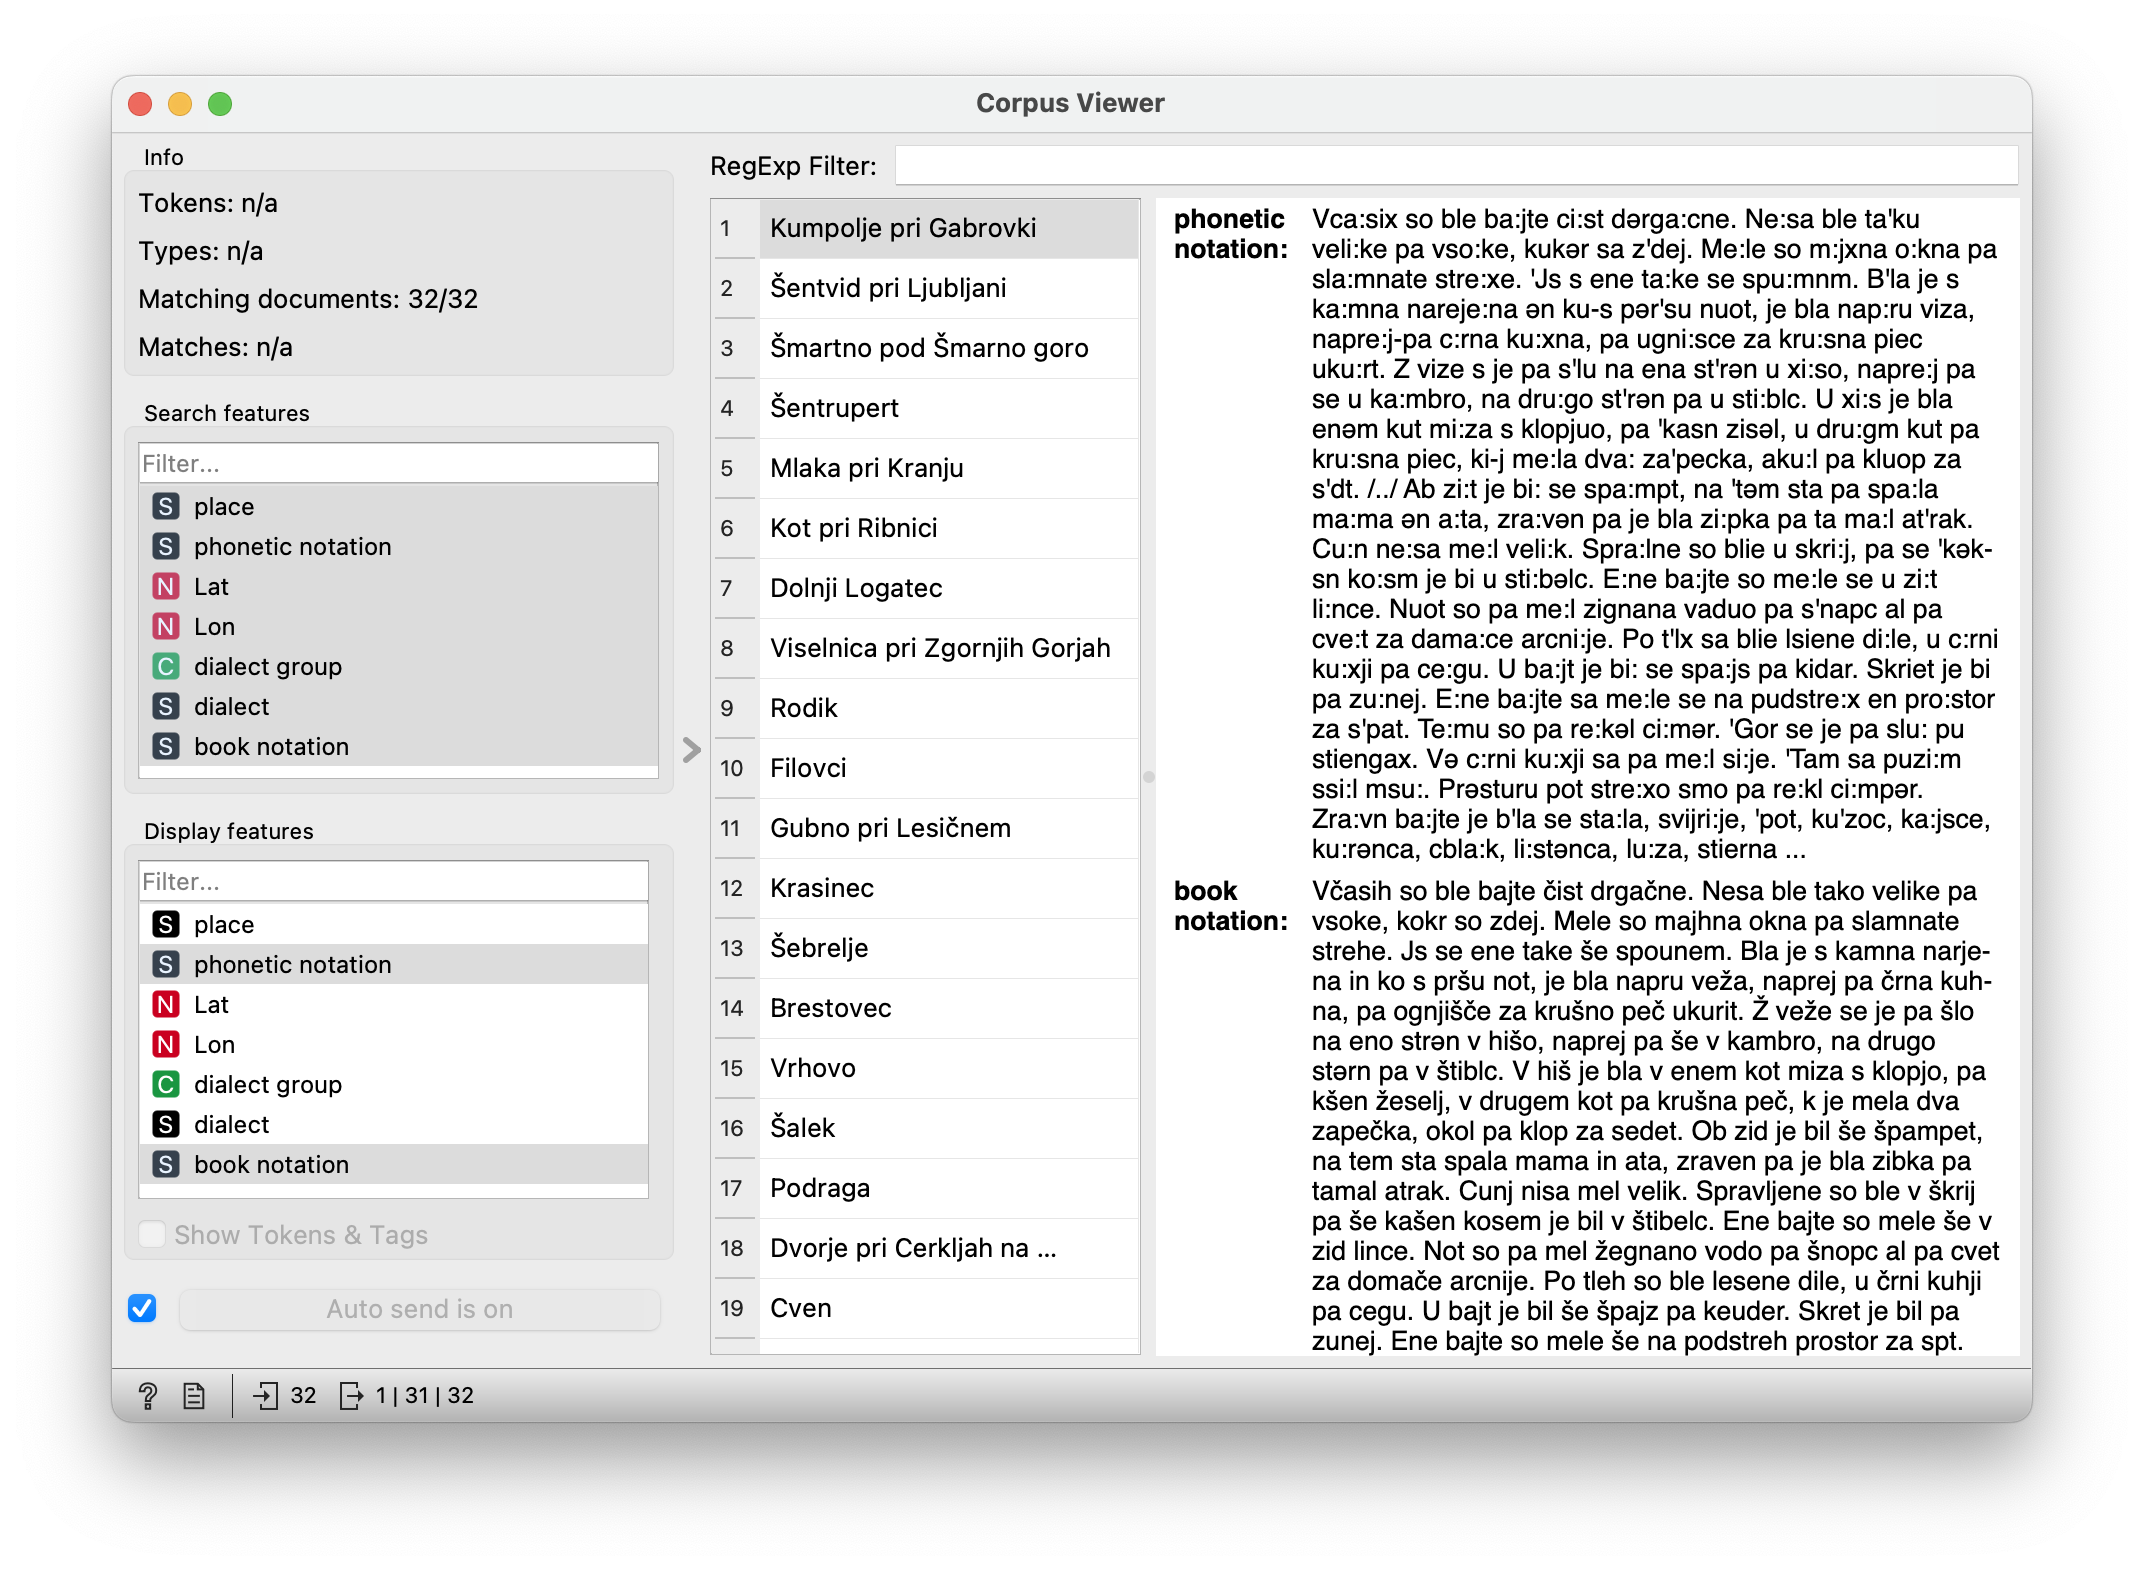
Corpus includes descriptions of old houses in phonetic and book notation. For this activity we will use the phonetic notation and observe which voices are typical for which region of Slovenia.
We upload the data (dialects with phonetic notation) to Corpus (make sure that only “phonetic notation” is included in the “Used text features”) and link it to the Corpus Viewer. There we observe the difference between the phonetic notation and the book notation. We try to find out which features are important for the differentiation.
Preparing data for the computer
We explain that the computer needs a numerical description of the documents to be able to compare them by similarity. What would be the basic unit of dialects to be able to compare them successfully? Of course, it could be a word, but for a phonetic notation it would be more useful to have individual characters or sounds.
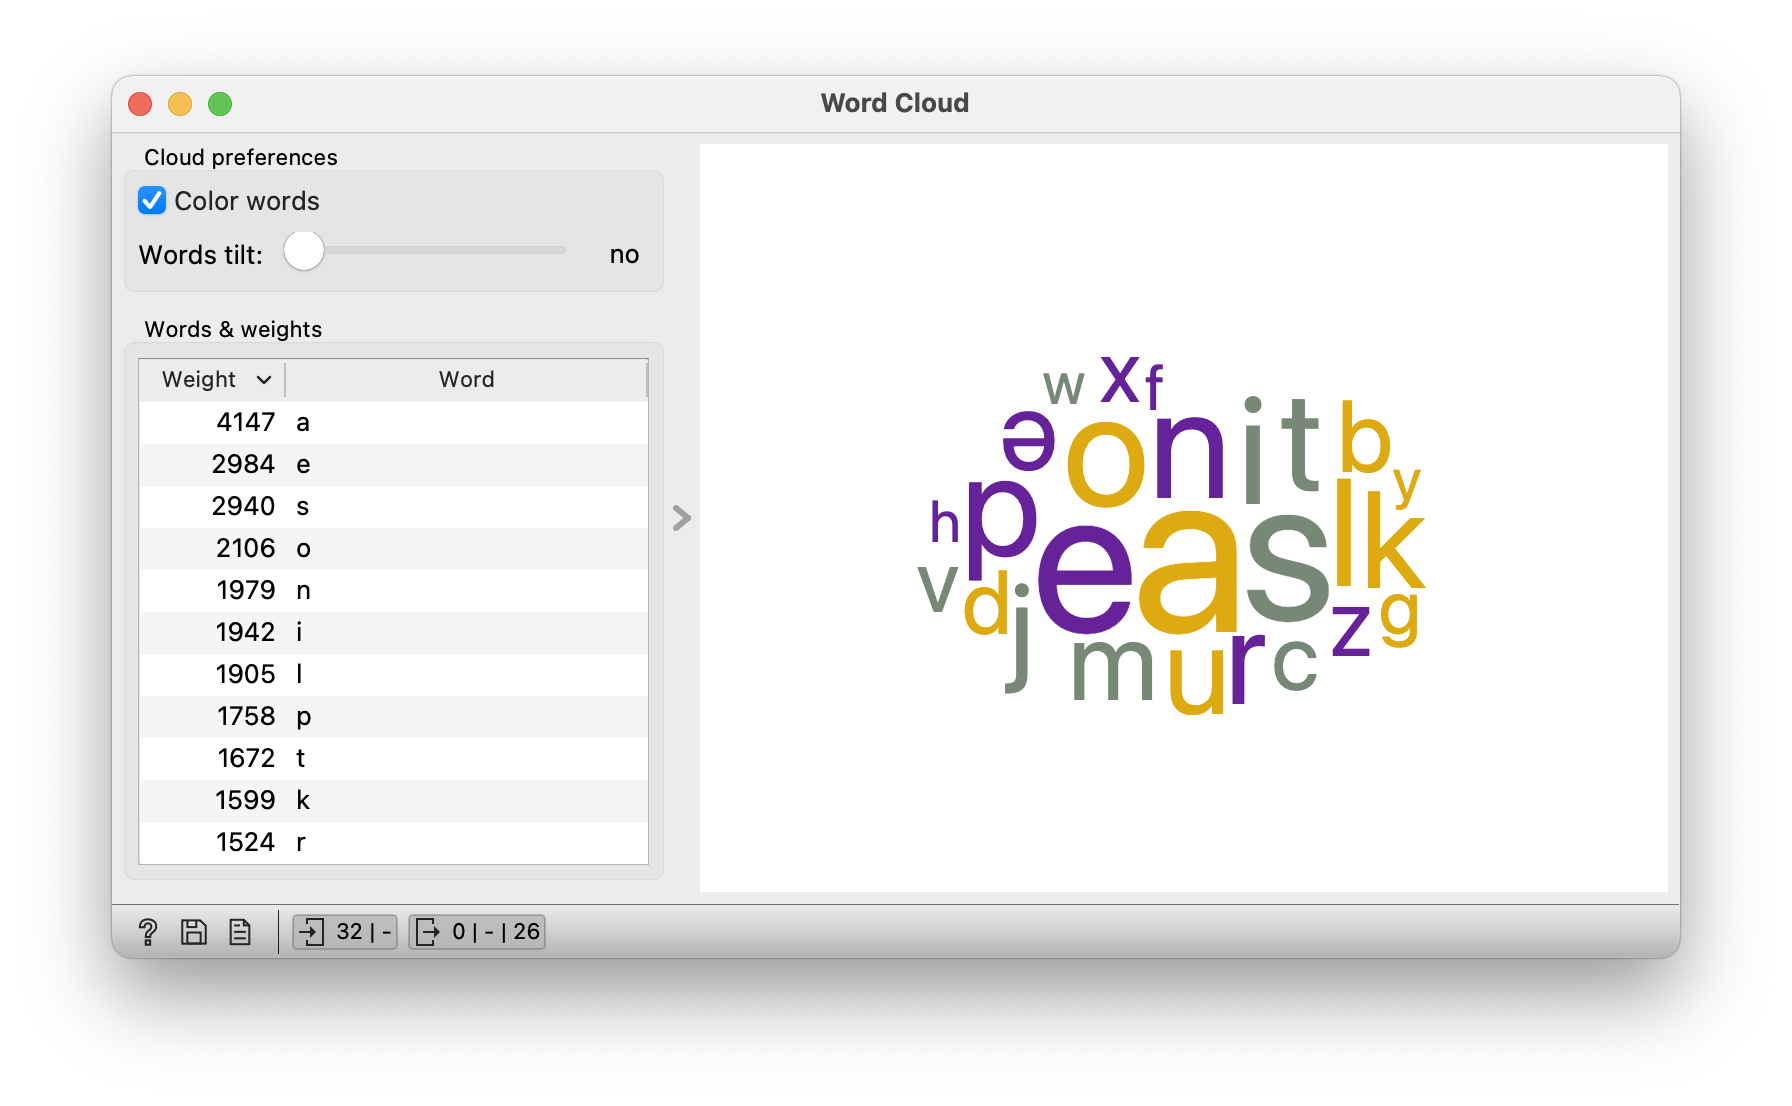
First, we need to divide the text into basic units, i.e. letters. This is done using the Preprocess Text widget, which prepares the text for further analysis. To divide the text into letters, we use a regular expression \[a-zə\].
We look at the Word Cloud widget and find out which are the most common sounds in Slovenian. Obviously a and e, then s. (Ask them if they play Wordle or Besedle. How would this knowledge help them in the game?)
As mentioned, the computer works with numbers. We have broken the texts down into individual sounds, but we have not yet described the texts numerically. What is the easiest way to do this? Probably by counting the letters or sounds.
We will take our 26 letters and count how many times they appear in each text. This is called a Bag of Words.
But counting alone is not enough. Let’s take a look at the records from Šentrupert (short) and Vrhove (long). What is wrong with just counting occurrences? The text from Vrhove is likely to have more letters than the text from Šentrupert. What we are interested in is not how long the text is, but how often the letters appear.
To get around the problem of high frequency of letters that are common in text, we can use a transformation that weights the frequency according to how common the letter is in the text. If a letter appears in all texts, it should have a lower importance (weight) than a letter that appears frequently in few texts. This procedure is called TF-IDF and is a very popular technique in text mining.
Hierarchical sorting
Let’s compare the texts. We will take the counted letters from the bag of words and compare them with each other. We will calculate the similarity using cosine distance, which creates a matrix of similarities or distances. The distance matrix, for example, shows that the distance between the examples is very similar to the distances between places we know from atlases.
Then we add Hierarchical Clustering, which groups elements by similarity. The two elements that are most similar will be grouped together first. Then the next two most similar elements, then the next, and so on. We can also group groups. If an element is closest to a group, it will join it.
The process of hierarchical clustering can be explained by a kinaesthetic activity in which we form groups of students according to two fictional criteria, for example maths knowledge and football skill. See the supporting activity Hierarchical clustering.

The hierarchical clustering is shown in a visualisation called a dendrogram. The dendrogram is read from right to left, starting with the texts in their own branches and then grouping them by similarity. The longer the line between the two elements, the lower their similarity.
The dendrogram can be cut at any height to give the desired number of groups. For example, five groups.
Dialect maps
We can look at the selected groups on a map, so we know where the speaker is from. There is even latitude and longitude information in the data.
We add the results of the hierarchical clustering to the Geo Map widget, where we colour the points by cluster. Ask students if they think the clustering makes sense. Why yes/no?

What can we conclude from the map?
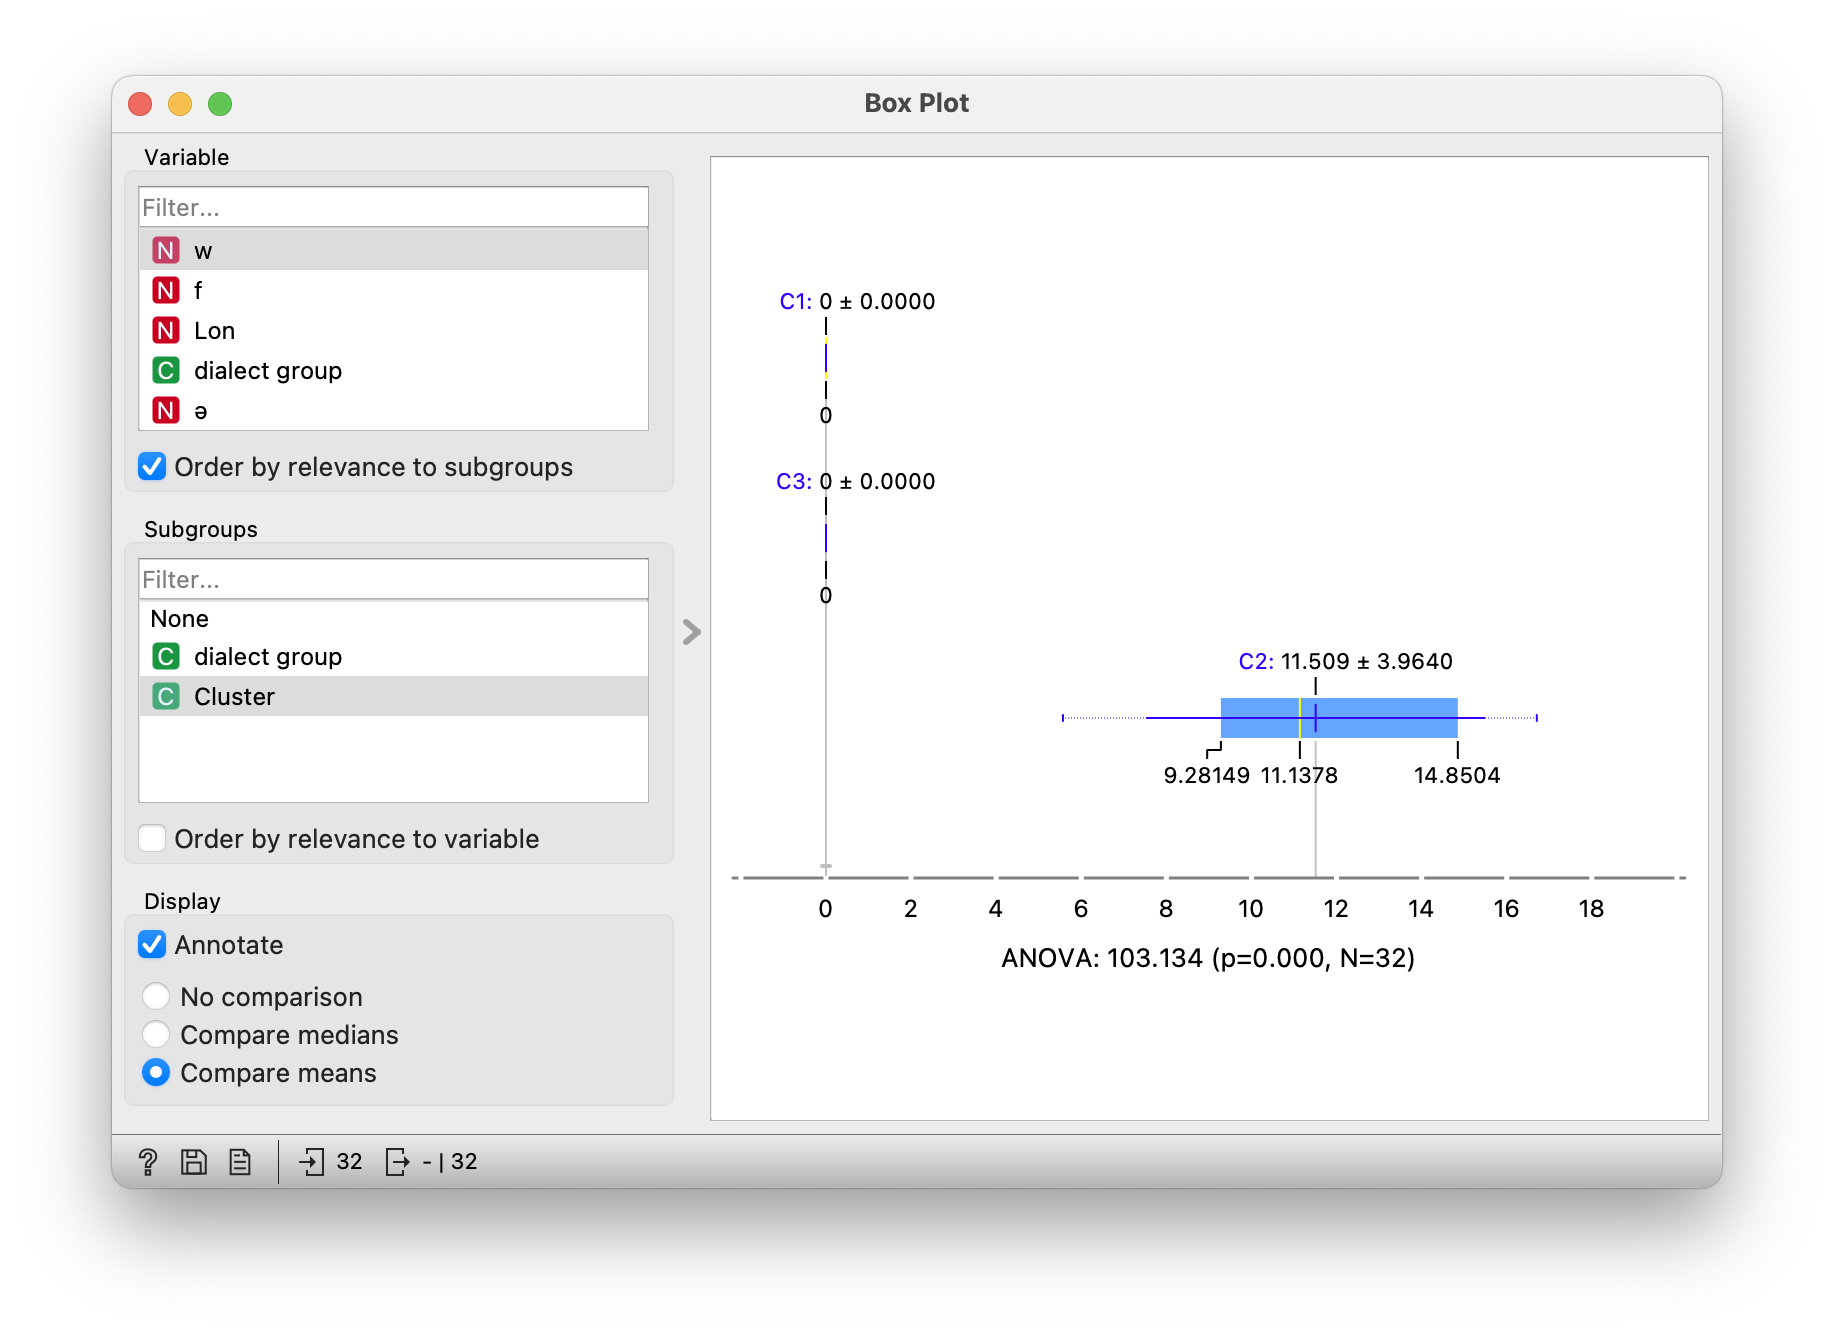
Let’s investigate why the computer made this decision. We will explore the selected groups in the Box Plot widget. We will split the data by group, which means that in the Subgroups section, we select the variable Cluster.
We then use statistics to help us identify the variables that best separate the groups. This statistic is called ANOVA and is an estimate of the difference between the groups. In graphical terms, this means that we look for variables where the groups are as separate as possible (have as different distributions as possible).
This is done by the option " Order by relevance to subgroups". When selected, the variables are sorted so that the variable that best distinguishes between groups will be at the top of the list. Obviously, this is the letter w, which represents the voice uə. This marks group two, i.e. the primorska dialect.
Do you know how the locals refer to Ajdovščina?
Students can also try it themselves. What characterises the štajerska dialect group? Does anyone know how they pronounce “včasih” in štajerska?
Conclusion
We tell students that computers can easily edit large amounts of text. They can cluster them (like we did), they can predict class (e.g. author, political party affiliation or sentiment), they can even generate new texts. Clustering is used in particular to organise large groups of texts.
- Subject: slovenian
- Age: 1st year
- AI topic: clustering
- Materials
- Preparation for the lesson
- computers with Orange and Text add-on installed
Placement in the curriculum
In terms of Slovenian: understanding the similarities between Slovenian dialects and phonetic notation.
In terms of AI: students learn how to work with collections of texts. They learn how to divide a text into units (sounds) and then count the sounds in the text. They then learn how to arrange documents by similarity (phonetic pronunciation). They learn how to investigate the groups they have found and how to make sense of them.
Foreseen necessary widgets of Orange: Corpus, Preprocess Text, Bag of Words, Distances, Hierarchical Clustering, Geo Map, Box Plot
Student:
- lists the basics of phonetic notation,
- list dialect groups and subgroups,
- list the basic parameters of the divisions into dialect groups (presence or absence of sounds, diphthongs),
- draw, read and explain a graphic representation (e.g. a box plot).