Climate zones of Europe
Introduction
Let’s upload data with climate indicators for European cities. Each row is a city described by its average temperature, number of sunny, rainy and snowy days, amount of precipitation and so on. Invite the students to list the European capitals together. Can they find an intruder among the data? For example, Istanbul?
Observing the data
The data can be found in the Datasets widget. They are located among the English data under the name ‘Climate of European cities’. Double-click on them to load or activate them.
Once the data is loaded into Orange, we link it to the Data Table widget. Let’s see what data we have. Let’s discuss whether the data we have collected is sufficient to separate by climate zone. What are the characteristics of the climate zones? E.g. Mediterranean, continental, oceanic climate?
Hierarchical sorting
Let’s compare European cities with each other. We will take data from weather stations and compare the cities with each other. We will calculate the similarity using Euclidean distance, which creates a similarity matrix or distance matrix.
Then we add Hierarchical Clustering, which groups cities by similarity. The two most similar cities will be grouped together first. Then the next two, then the next, and so on. We can also cluster groups. If a city is closer to a group than to another city, it will join the group.
This process is called hierarchical clustering and is shown in a visualisation called a dendrogram. The dendrogram is read from right to left, starting with the places in their branches and then grouping them by similarity. The longer the line between the cities, the lower their similarity.
The process can be explained by a kinaesthetic activity in which we form groups of students according to two fictional criteria, for example maths knowledge and football skill. See the supporting activity Hierarchical clustering.
The dendrogram can be cut at any height to give the desired number of groups. For example, five. Do the resulting groups correspond to climate zones? In which group is Ljubljana?

Climate zones
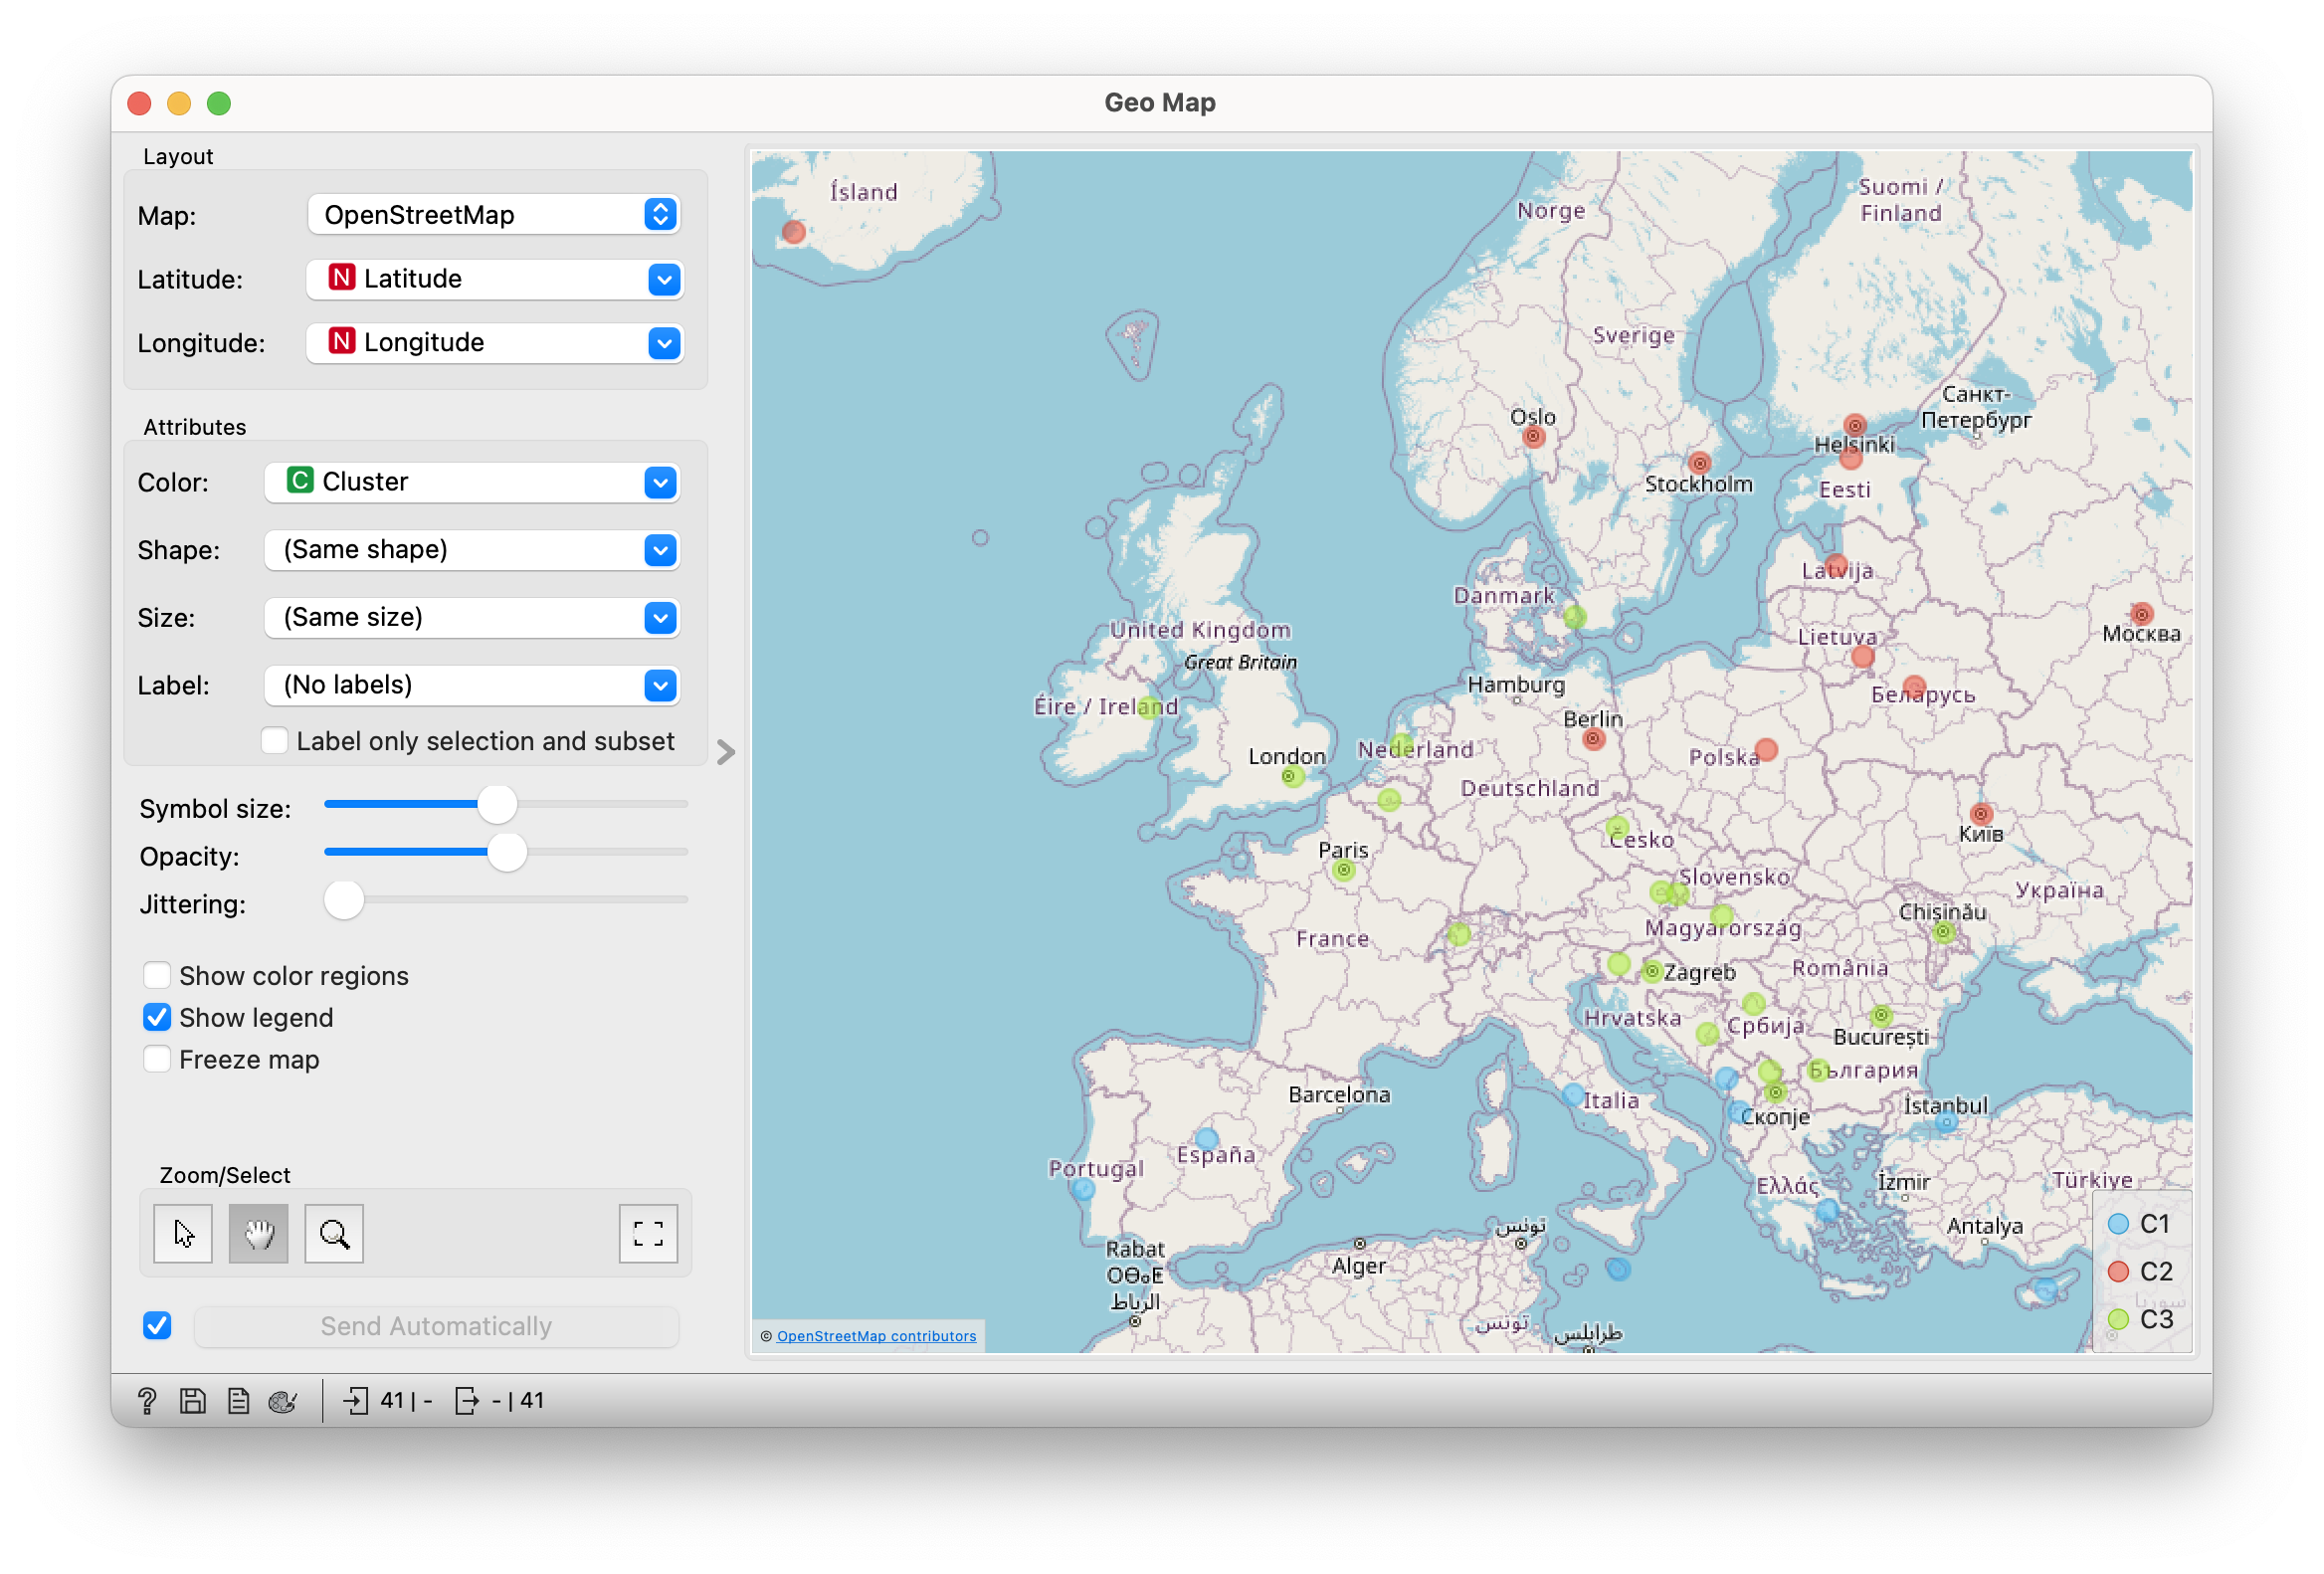
We can look at the selected groups on a map, as we know the latitude and longitude of the city. In the data, this is written in the variables Lat and Lon.
The results of the hierarchical clustering are sent to the Geo Map widget, where the points are coloured by cluster. Ask students if they think the clustering makes sense. Why yes/no?

Do clusters correspond to climate zones?
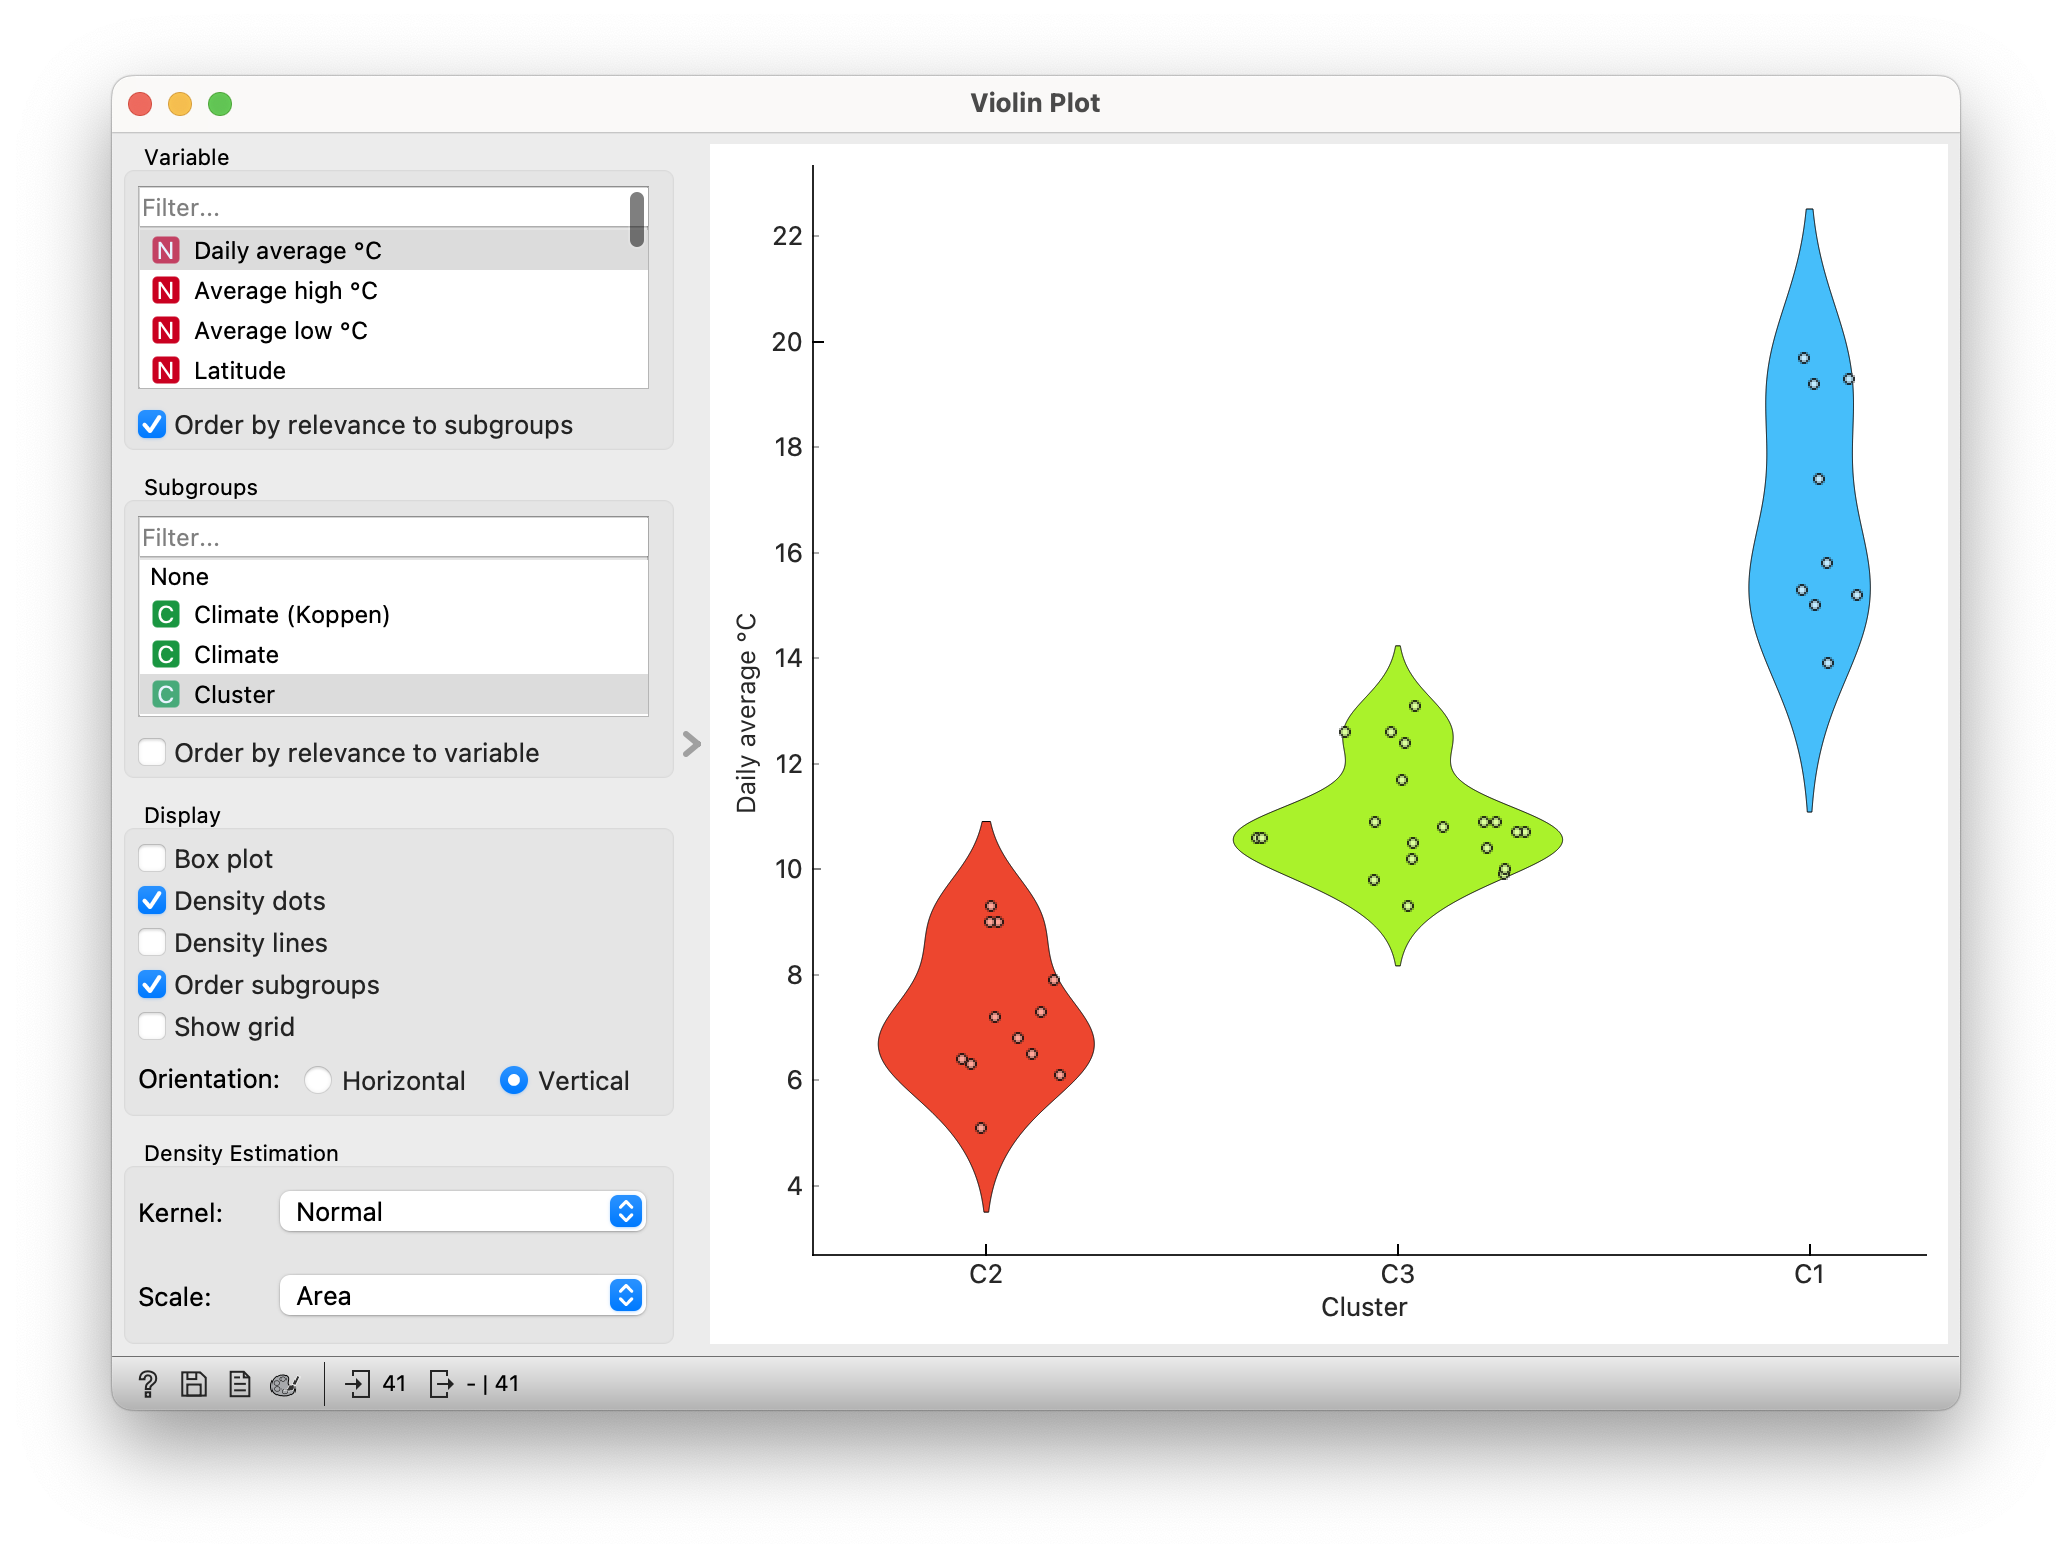
Let’s investigate why the computer made this decision. We will explore the selected groups in the Violine Plot widget. We will split the data by group, which means that in the Subgroups section we select the variable Cluster.
We then rank the variables according to how well they separate the detected groups. In graphical terms, this means that we look for variables where the groups are separated as much as possible.

Apparently, the daily average temperature is the best way to distinguish between groups. Which countries have the coldest climates?
What is the average daily temperature in Ljubljana?
Exercise
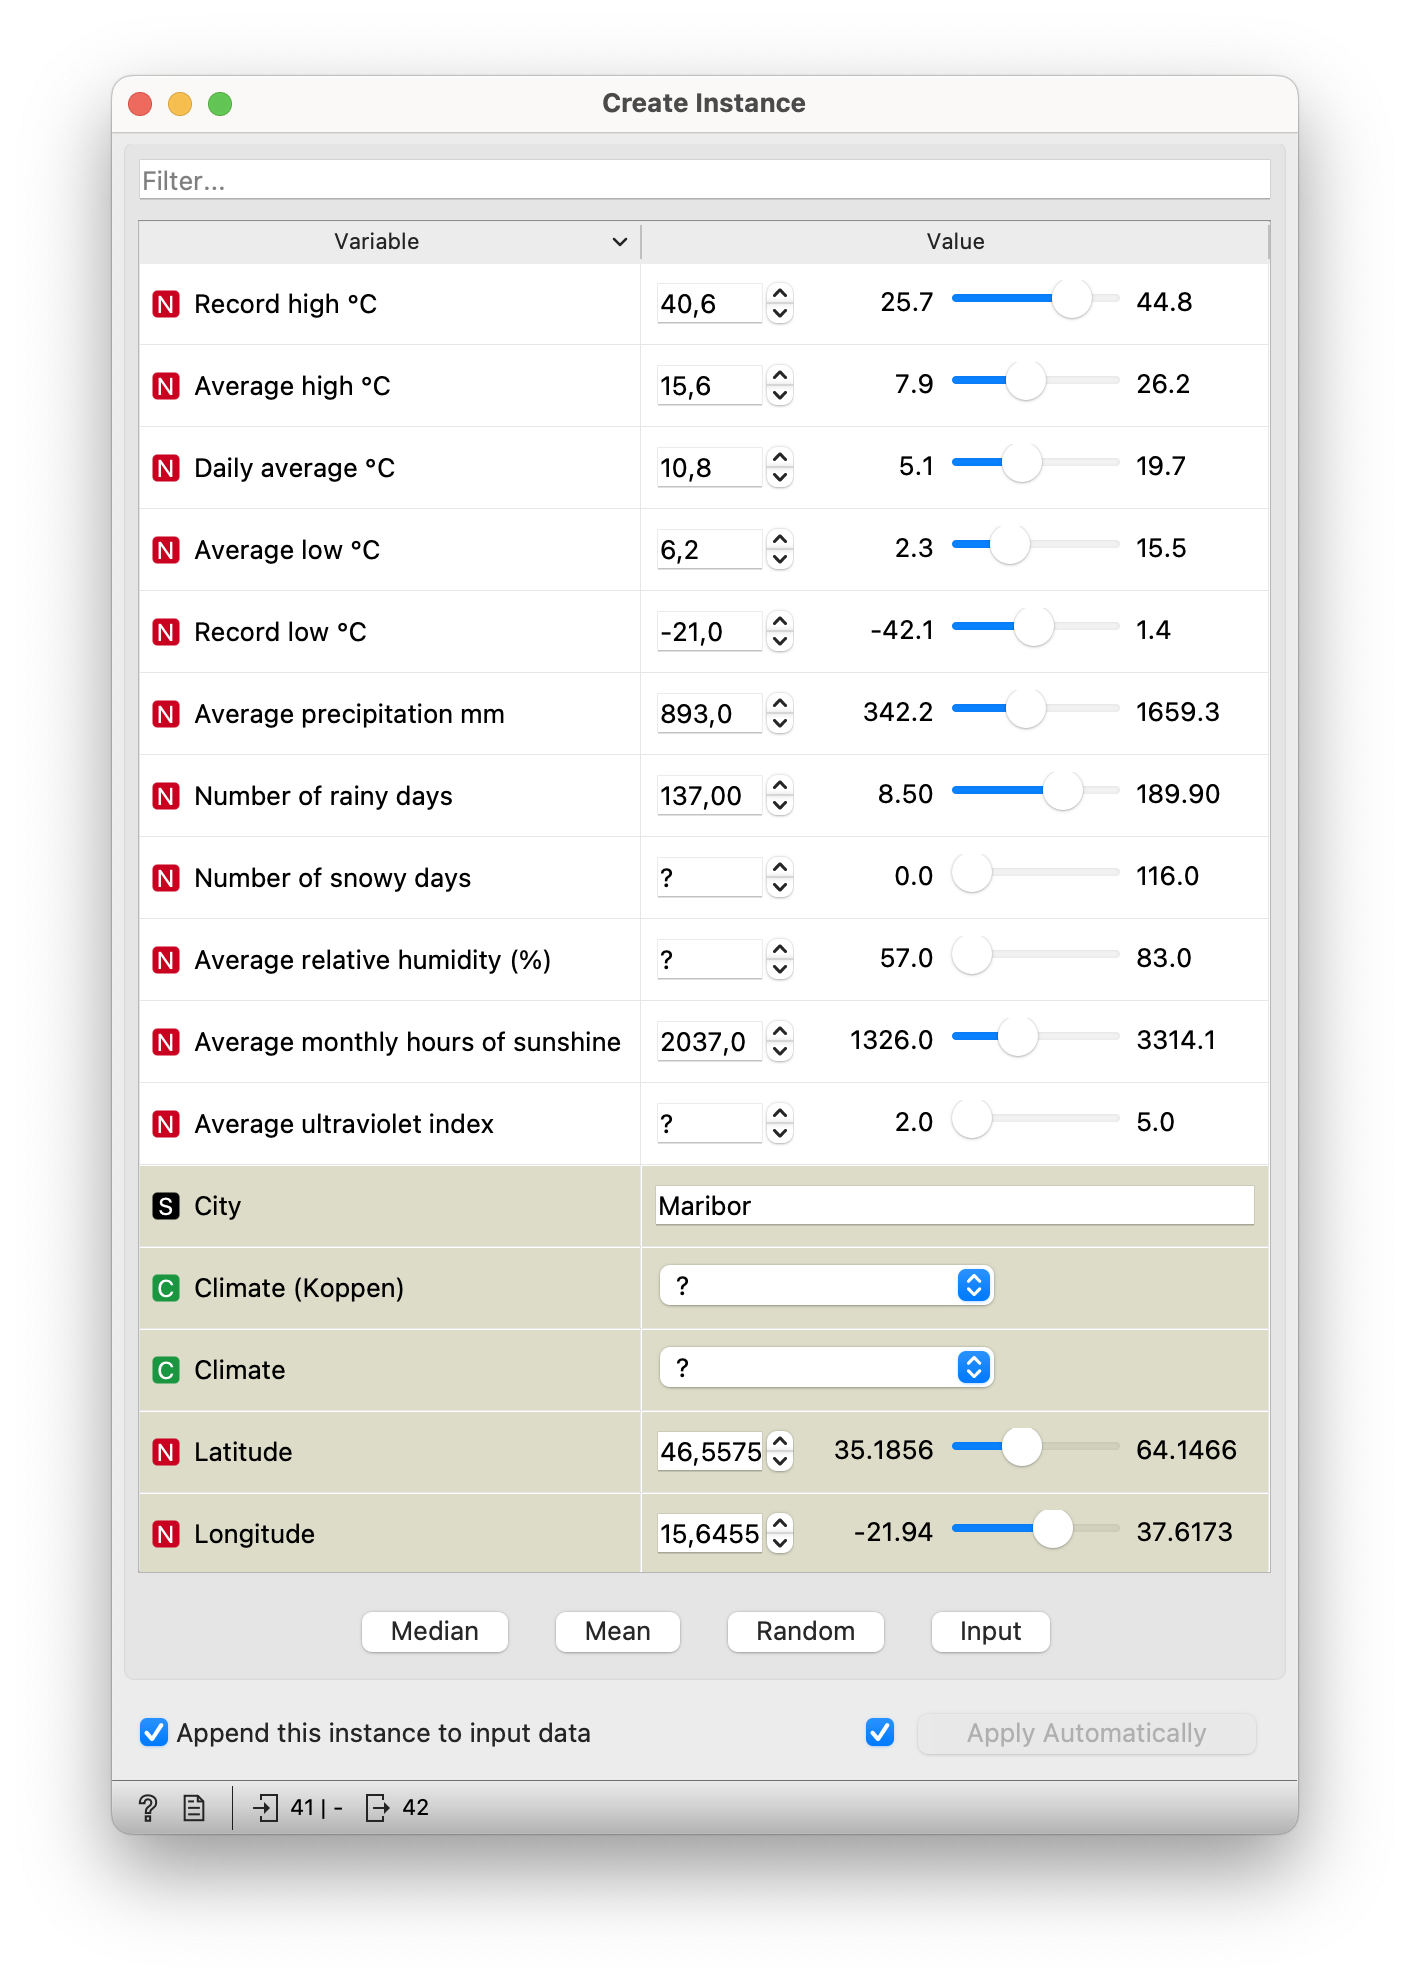
In which group does another Slovenian city, for example Maribor, belong? Will it be more like Vienna, Ljubljana or Zagreb? (You can also choose some other European city.)
Students find information for a chosen place (e.g. from Wikipedia) and add it to the table. They do this using the Create Instance widget. If they cannot find the information online, they delete the predefined value and a question mark appears at that position. This means that the data is unknown. They then look to see which group it fits into.

Conclusion
Nowadays, a wealth of data is available online on all sorts of things, including the weather in different parts of Europe. The data is collected by weather stations, which record information ranging from rainfall to the number of hours of sunshine. Some interesting information could be added to the existing data, such as the average temperature by season. Could this help to better distinguish between climate zones?
- Subject: geography
- Duration: 1 hour
- Age: 1st year
- AI topic: clustering
- Materials
- Preparation for the lesson
- computers with Orange and Geo add-on installed
Placement in the curriculum
In terms of geography: defining Europe’s climate zones, revisiting European capitals and their locations.
In terms of AI: Students learn how to calculate the similarity between instances and how to group them hierarchically. They learn to investigate and explain groups of countries and show them on a map.
Foreseen necessary widgets of Orange: Datasets, Distances, Hierarchical Clustering, Geo Map, Violin Plot
Student:
- lists the European capitals,
- names Europe’s climate zones and their main characteristics,
- orientate itself on a map of Europe,
- draw, read and explain a graphic representation (e.g. box plot).