Taxonomic keys for animal groups
Several things happen in this activity. Students
- observe the properties of individual groups of animals with appropriate visualizations,
- learn how to use the Orange environment, especially how to select subsets of data,
- discover the idea of classification trees as independently as possible (as we would call an animal key in artificial intelligence) and build such a tree,
- repeat and refresh animal groups (mammals, insects, fish…).
Activity is similar to the activity Visit to the zoo, which is intended for younger students.
Introduction
The data for this activity can be found in the Datasets widget. They are located among the English data under the name ‘Zoo’. Double-click on them to load or activate them.
Load a table with animals, which include some unclassified animals. Show the data in the table. Some of the animals are familiar to the students and some are unfamiliar. Can they identify which group they belong to (especially the strange ones, based on their characteristics)?
Observing the data
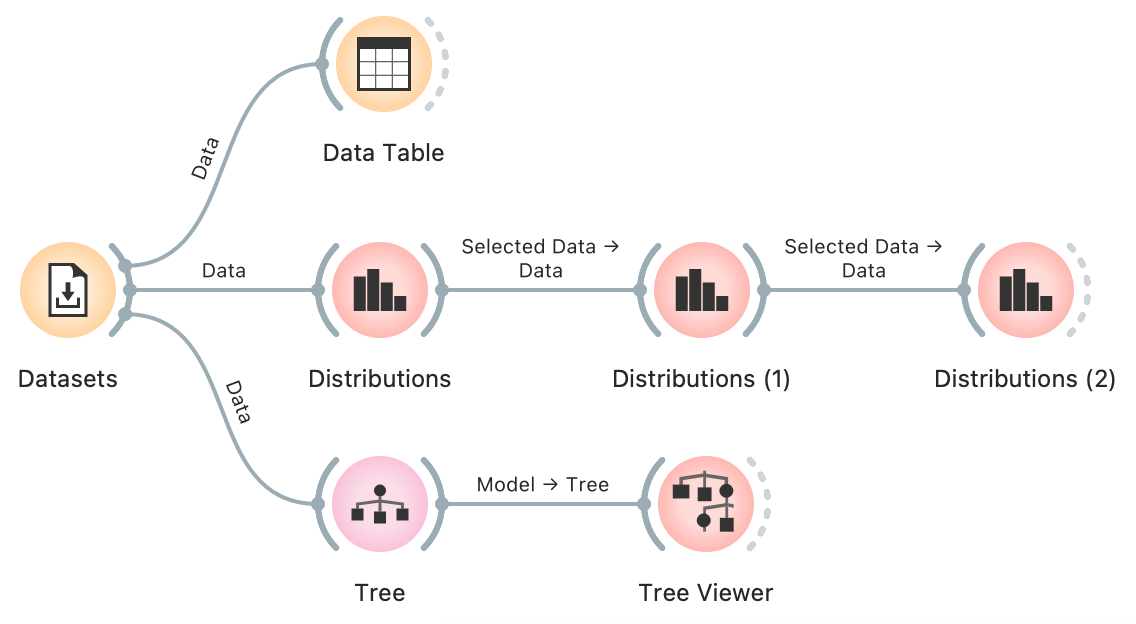
Link the data to Distributions widget.

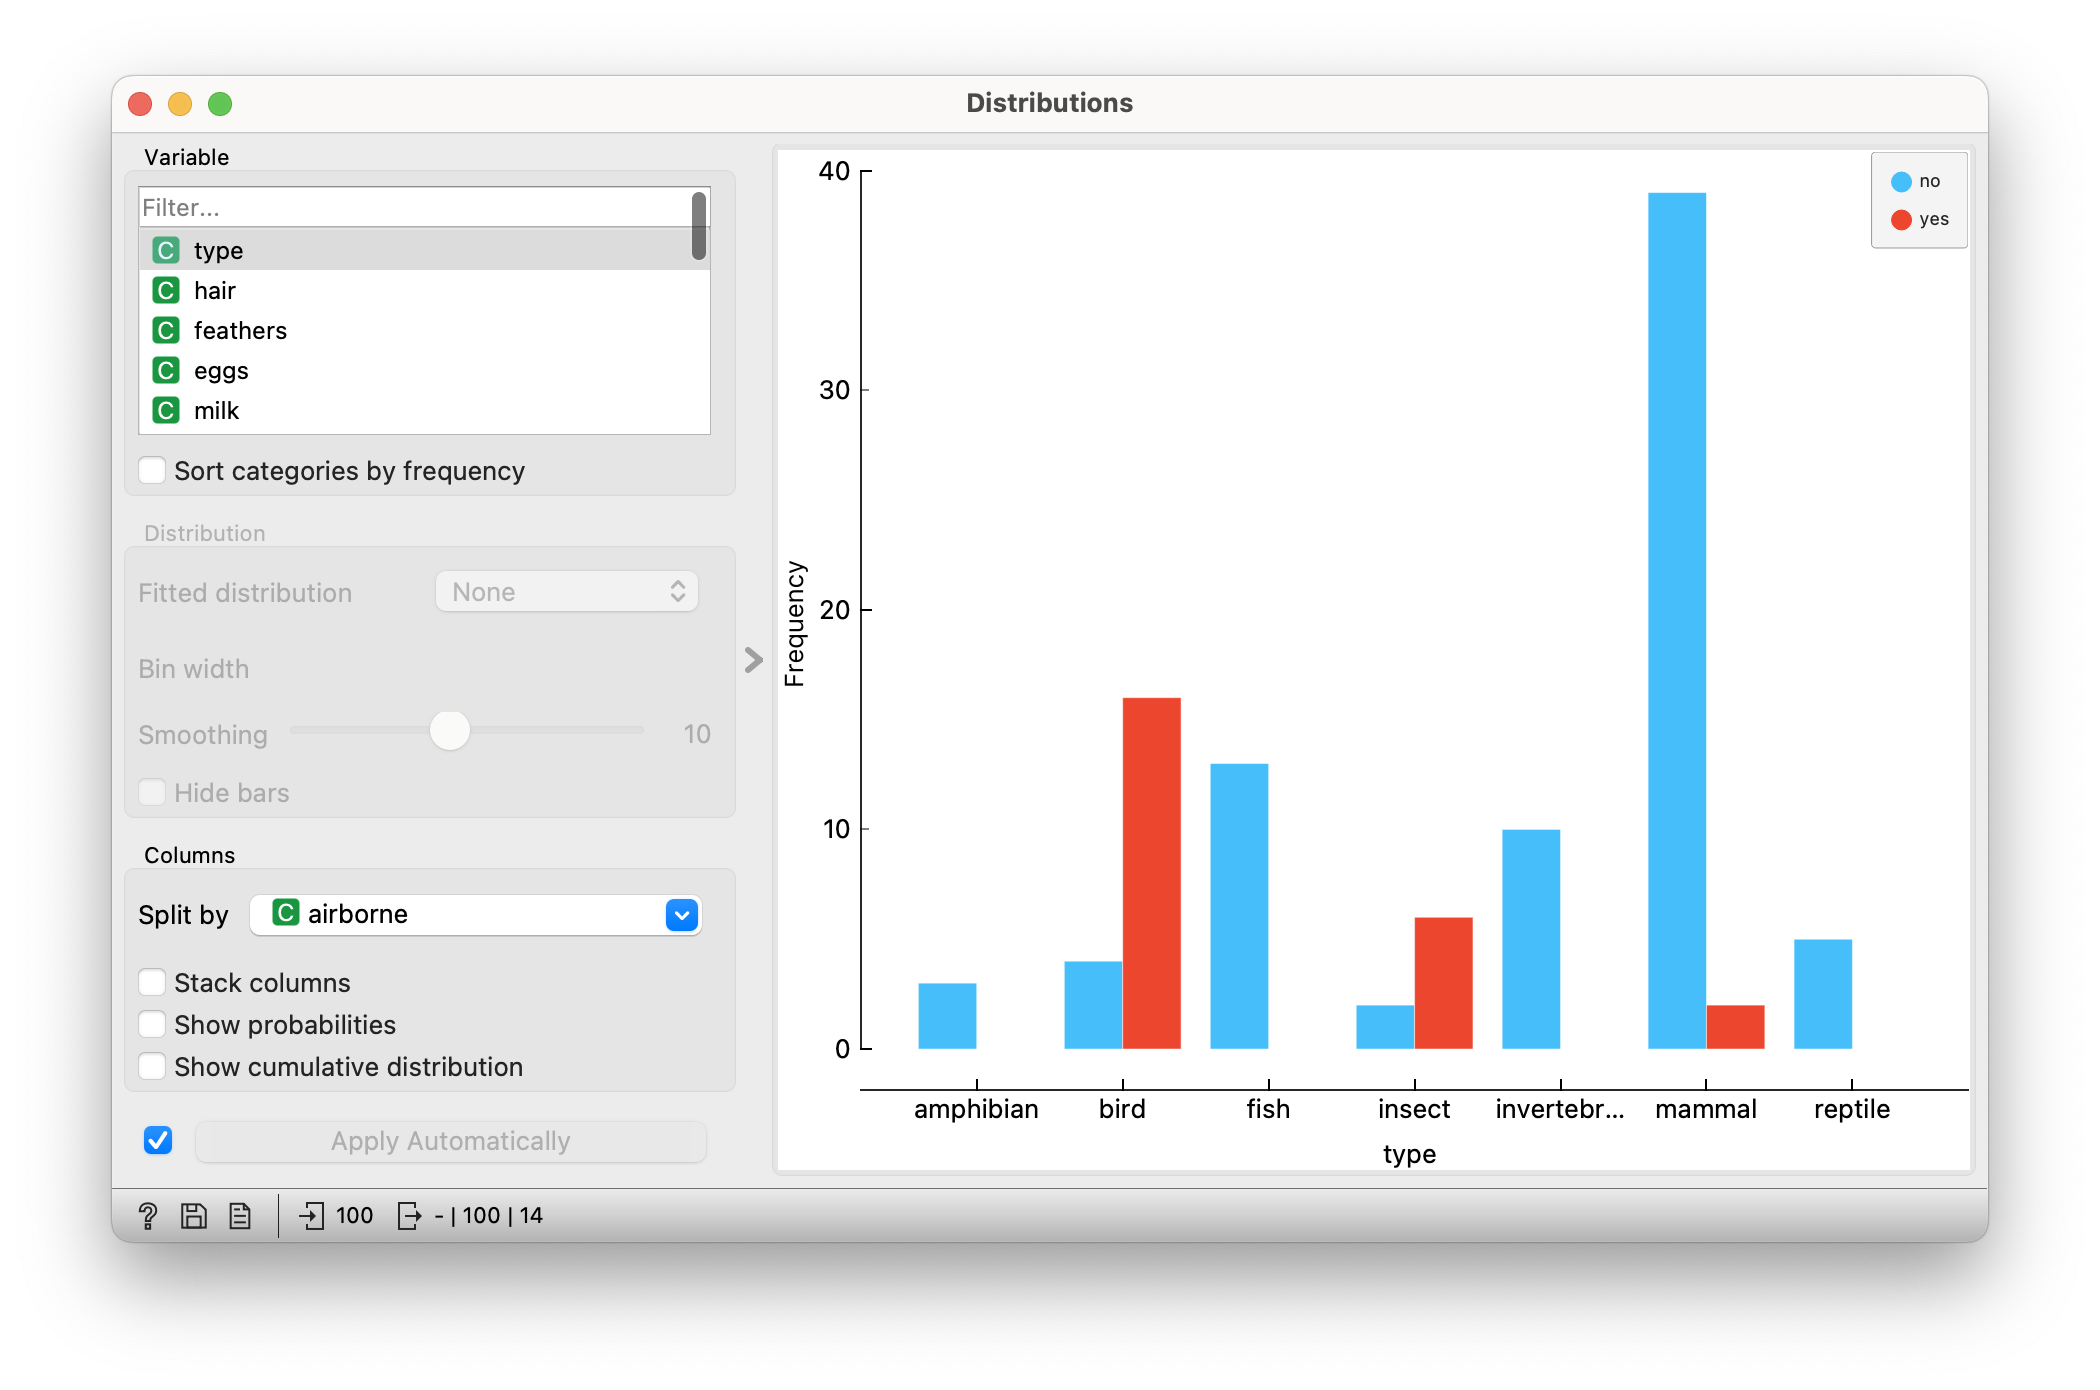
In Distributions, we select the animal group as the variable and divide the columns according to the individual criteria. This allows us to see, for example, how many animals from each group are flying.

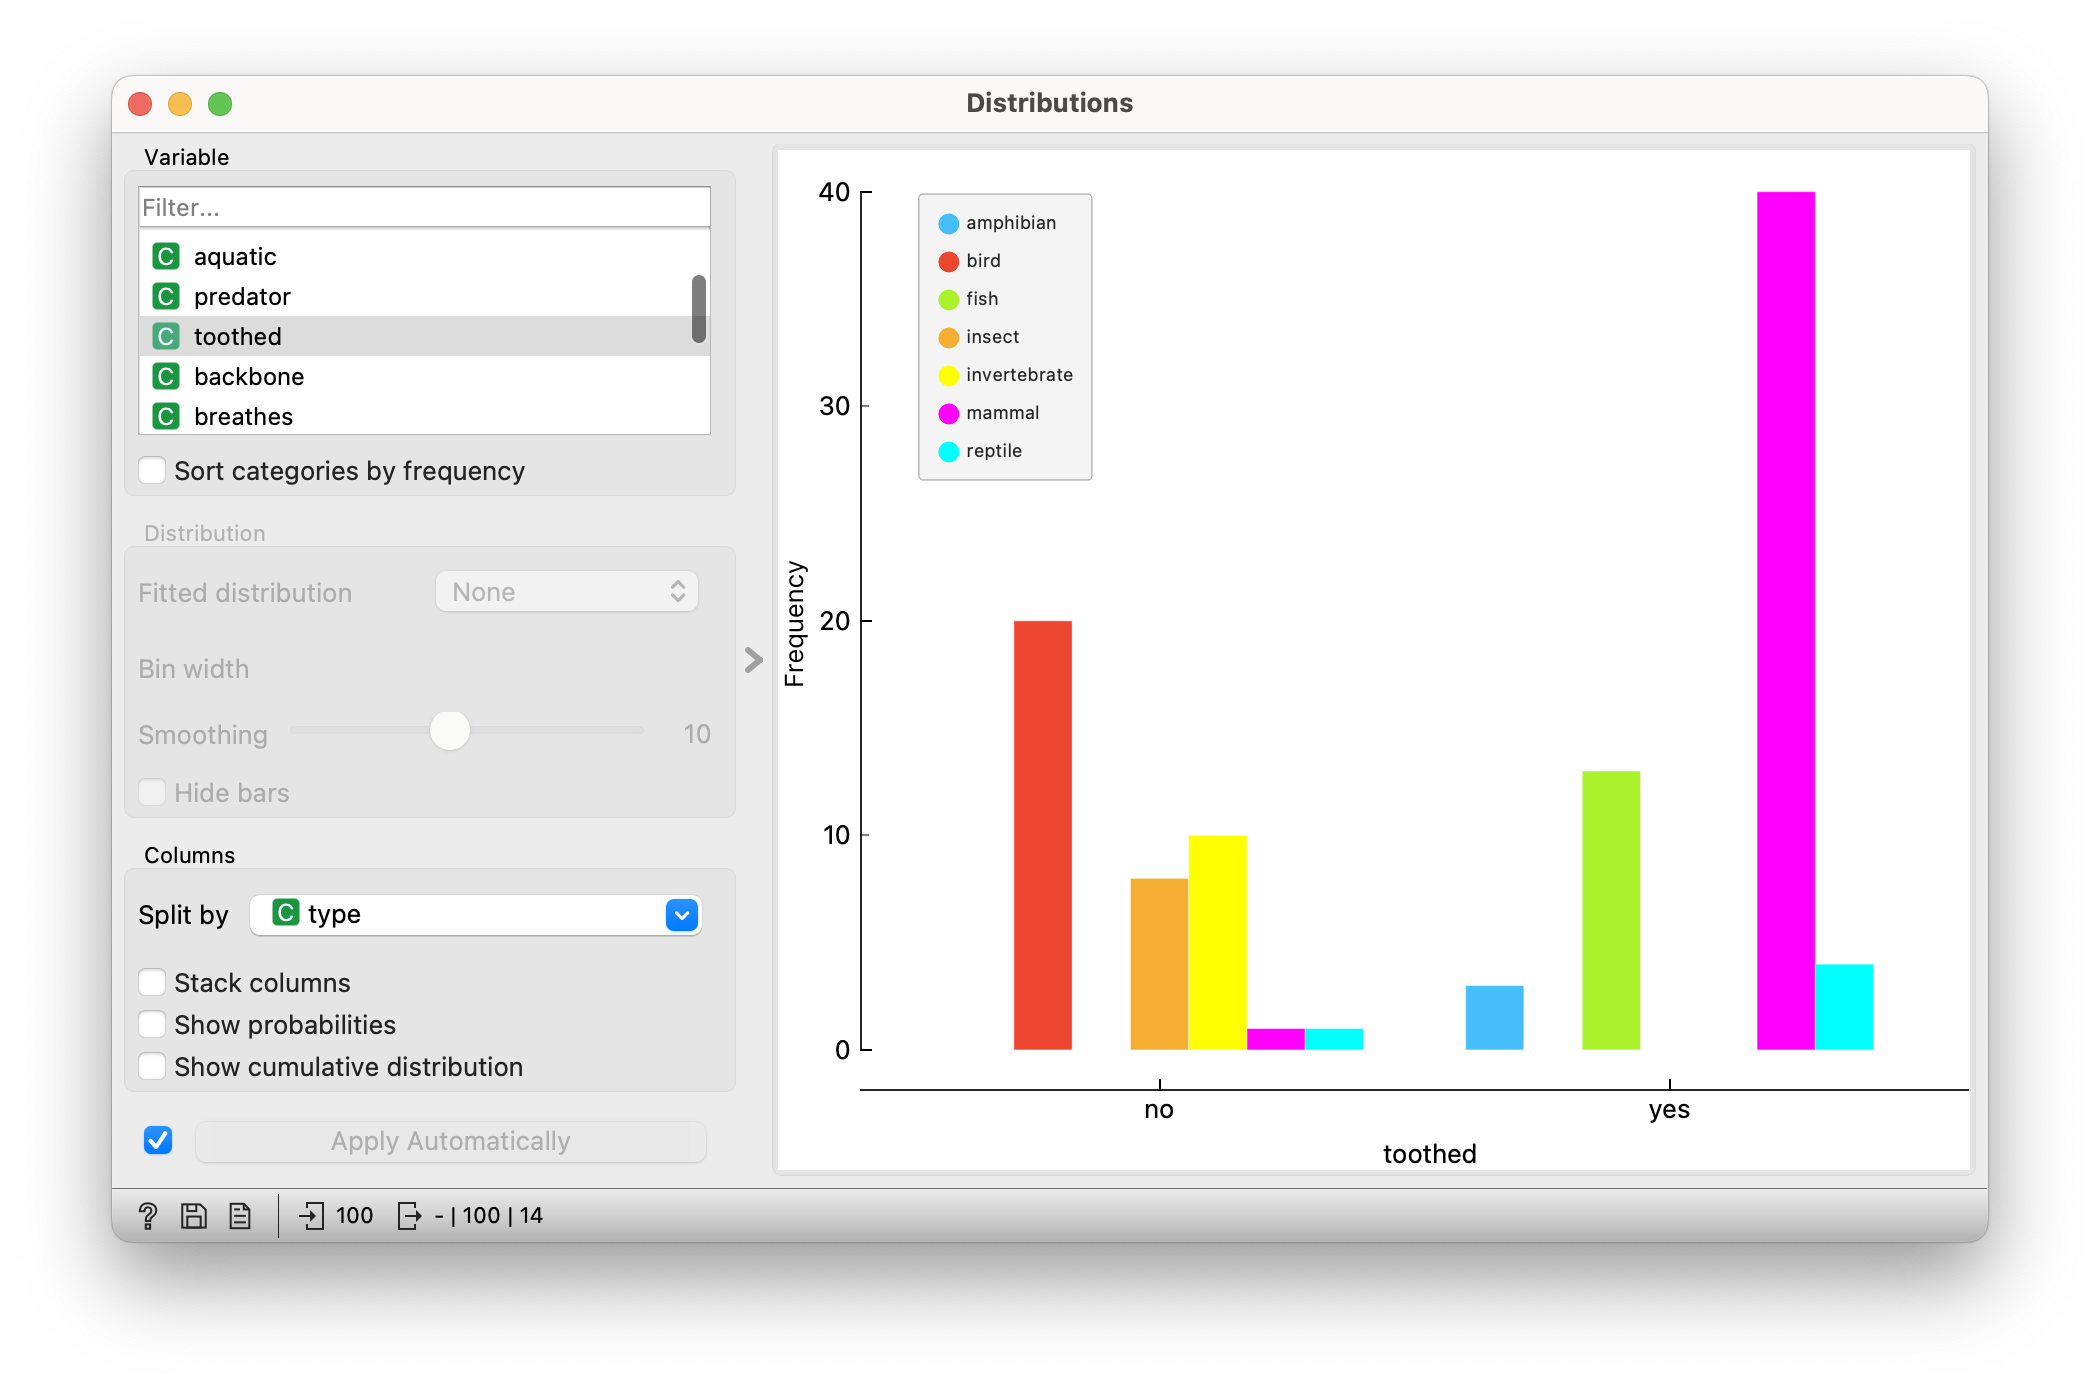
But if we want to build our own key to differentiate between groups, it is worth reversing the picture: we divide by type, choosing different characteristics as variables. For example, we see that fish and mammals have teeth, but birds, insects and invertebrates do not.

Together, frontally, we look for the piece of information that best distinguishes one group from the others. Let’s say we choose milk. In this case, we draw the start of the tree on the board - “milk”, in the “Yes” branch we write Mammal, and the branch “No” will continue.
In Distributions, select “No” and link the data to a new Distribution, which only gets the selected data from the first Distribution widget.
If the students are enough independent, they continue to build the tree: at each step, they find a variable that divides the rest of the animals well (in the example above, this would be the non-mammals). This could be a characteristic that is typical for a certain group, or it could be a characteristic that is typical for several groups, but not for some of them (such as, for example, to some extent, the teeth, in the first case, for all the animals).
If the students are not yet able to do this, the tree can be constructed in front of them. This gradually builds a tree that is useful for sorting.
Would you be able to write a recipe, instructions on how to build such a tree? (We try to get the students to describe as formally as possible the building process we have been carrying out. We do not force them to ask how to determine the “usefulness” of a particular feature.)
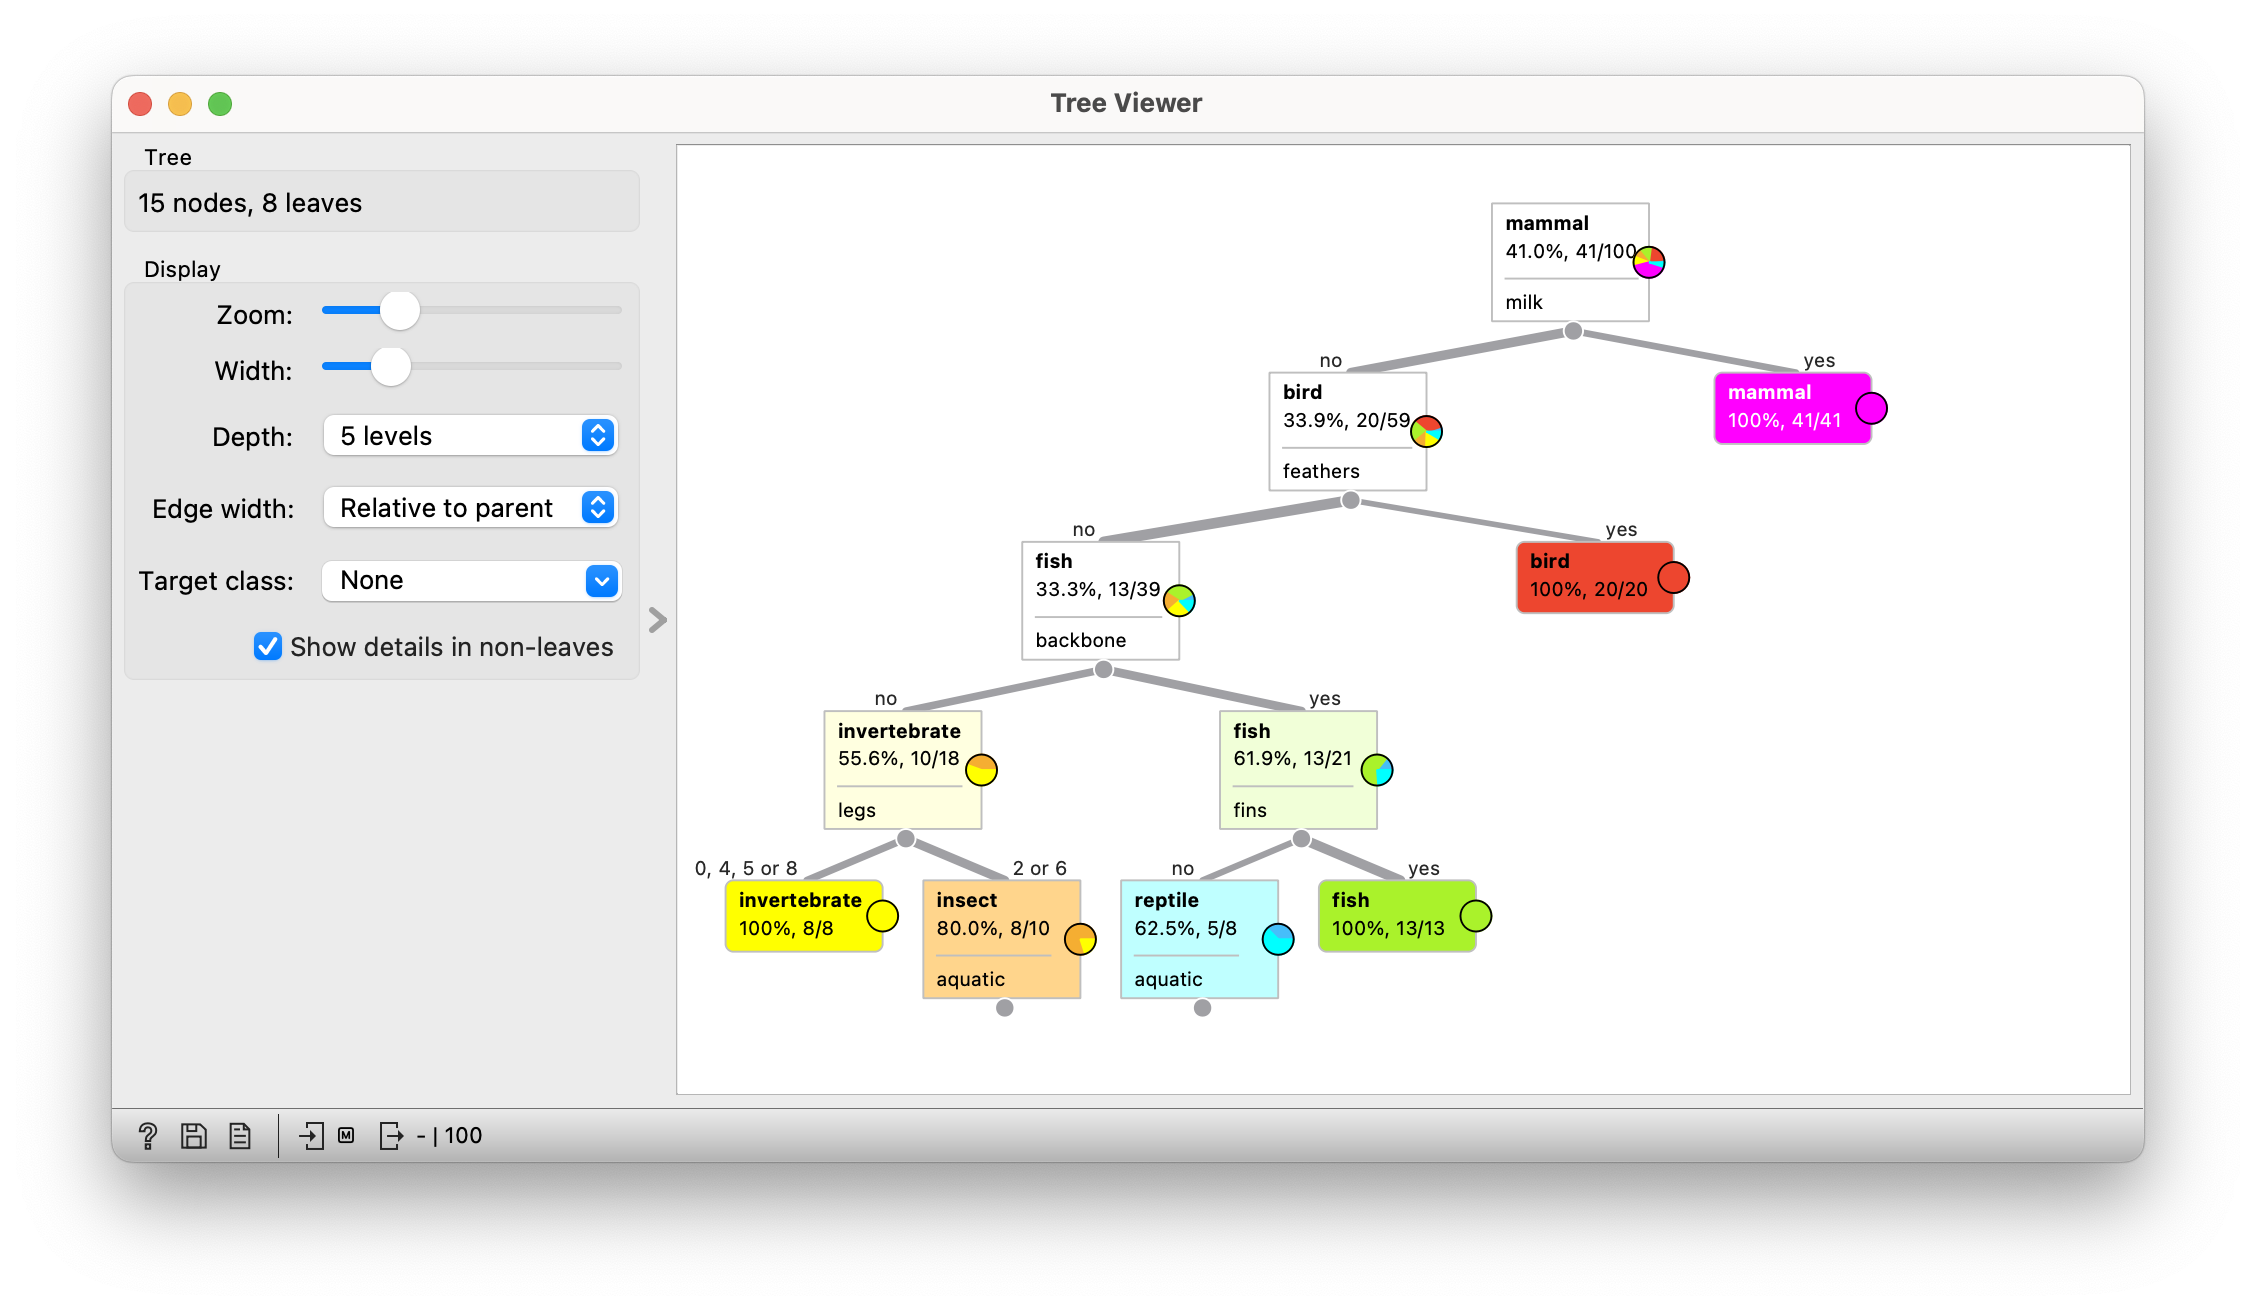
We say that this is indeed the procedure used. We show what kind of tree Orange builds from this data.

This is what the tree will look like:

This figure is used to classify animals that were not classified in the first table. With the Predictions widget, we look at how these animals are classified (according to the same model) by the computer.
Conclusion
We tell students that computers build models in a similar way from data for completely different domains. For example, we can build a model that predicts whether someone has a certain disease, which advertisement is worth showing to a visitor to a website, and whether there is an obstacle in front of a self-driving car. The model we have learnt about has the shape of a tree. Such simple models were explored mainly in the early days of artificial intelligence. Today’s models are more complex, but the basic idea is still similar.
- Subject: natural science, biology
- Duration: 1 hour
- Age: 6th grade
- AI topic: classification
- Materials
- Preparation for the lesson
- if we do not intend to carry out the activities entirely frontally, we will need a computer classroom; the computers must have Orange installed
- Further explanation
Placement in the curriculum
In terms of natural science: refresh differentiation between animal groups.
In terms of AI: students get to know a simple predictive model - a classification tree and learn how a computer can build it by itself. By doing this, they see how the computer “learns” from the data. They learn that this is only one representative among many. In terms of computer science in general: students describe an algorithm for building trees, so it is also about getting to know the concept of an algorithm.
Foreseen necessary widgets of Orange: Datasets, Data Table, Distributions, Tree, Tree Viewer, Predictions
Student:
- classify living things into groups according to common characteristics,
- defines species as the basic unit for classification and says that the main groups of living things are kingdoms,
- differentiates between invertebrates (snails, shells, insects, spiders, rotifers) and vertebrates (fish, amphibians, reptiles, birds and mammals),
- draw, read and explain a graphic display (e.g. histogram).